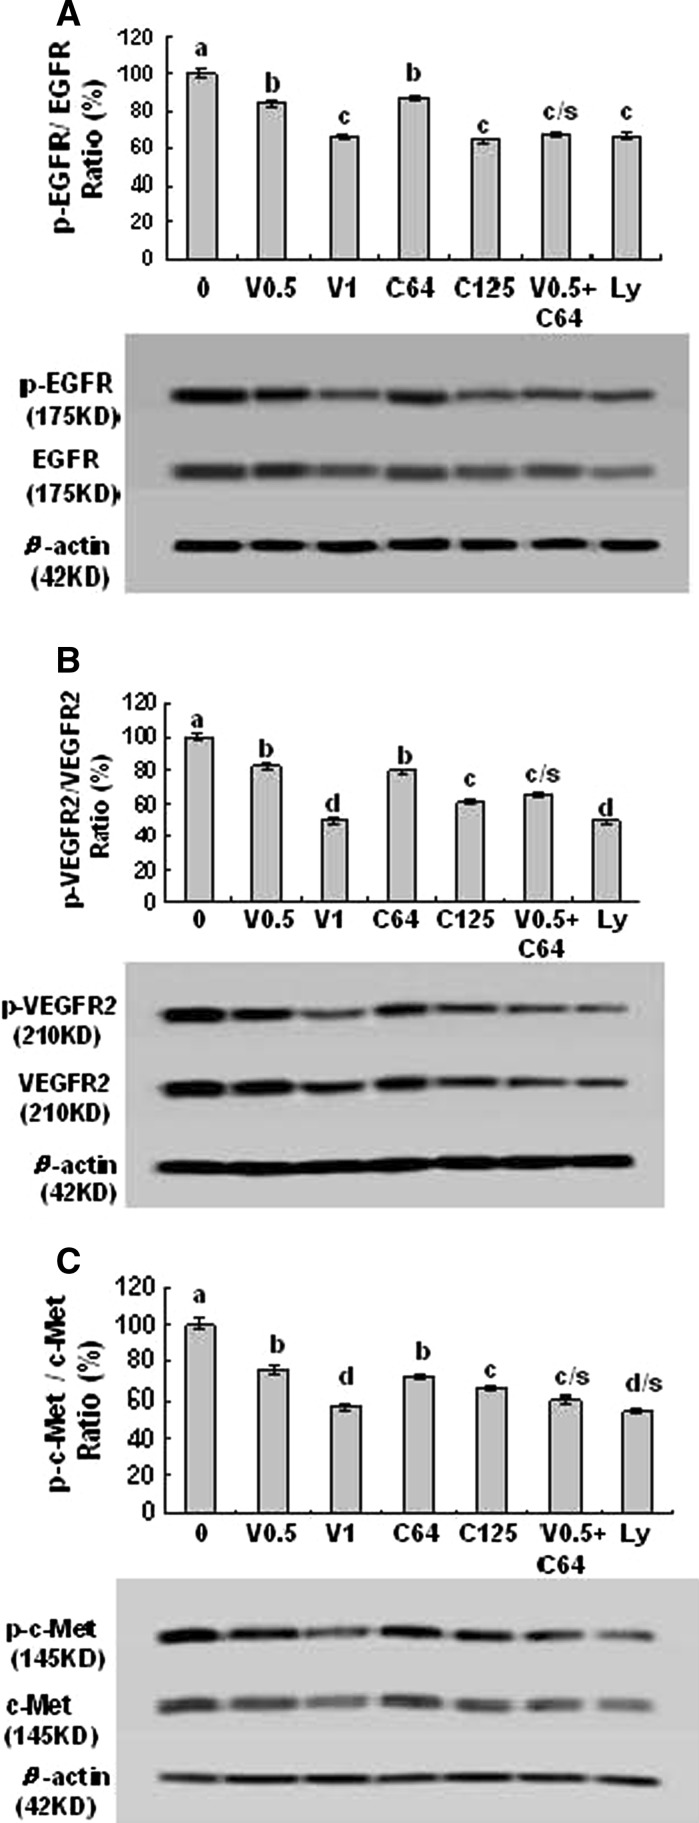
Fig. 4.
Effects of combination of VPA and HCCA on receptor protein expressions and phosphorylation of pEGFR/EGFR (a), pVEGFR2/VEGFR2 (b), and p–c-Met/c-Met (c) in LLC cells. The cells were treated with the indicated concentrations of VPA/V and HCCA/C (V0.5/0.5 mM, V1/1 mM, C64/0.064 mM, C125/0.125 mM), and Ly (0.0125 mM). The protein expression and phosphorylation were analyzed by Western Blotting. The optical density (OD) of the band was normalized with respect to β-actin and is expressed as relative optical density (OD). The OD value of the bands shown as mean ± SD was relative to that of the control (0, the DMSO vehicle) designated as 100 %. Ly is the inhibitor of PI3K/Akt. For one experiment, 3 assays were carried out and only one set of gels is shown. Values with different letters (a–d) differ significantly (P < 0.05). c/s and d/s represent the significant enhanced effects (P < 0.05) compared with VPA or HCCA alone

