
Fig. 6.
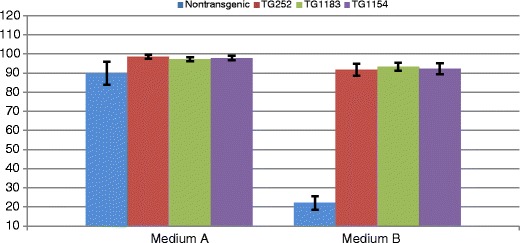
Survival rate analysis with standard deviations for cells from wild-type animal (blue), from F0 (TG252) with α-galactosidase expression (red), F1 animal (TG1183) with α-galactosidase expression (green) and TG1154 with the expression of α1,2-fucosyltransferase (purple) measured in the basic medium and in test medium B containing 50 % human serum. The survival rate was measured by an average number of living cells compared to the total number of counted cells in 12 repetitions. The percentage cell survival rate is shown on the y-axis