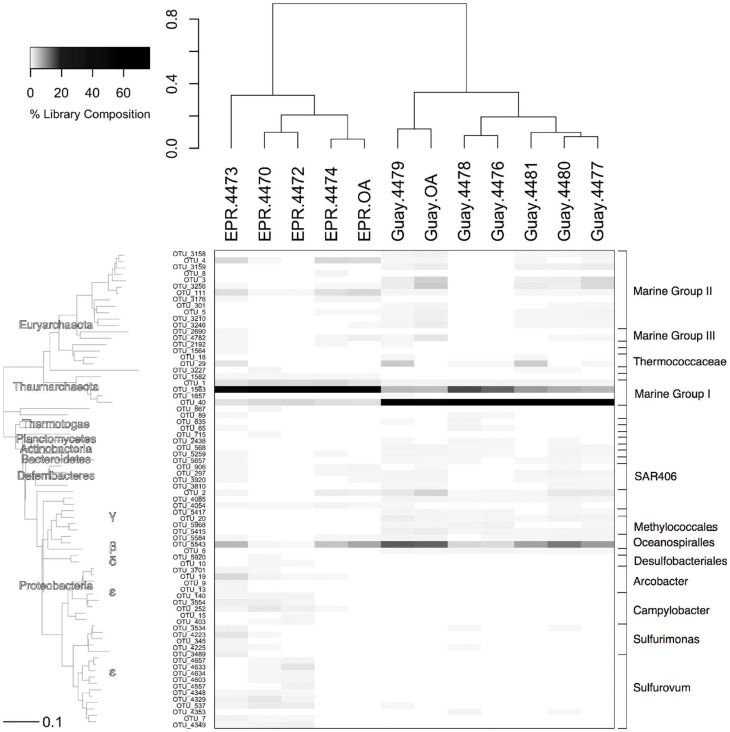
Figure 5.
Relative abundance of OTUs from the entire microbial community of the indicated sample with their corresponding phylogenetic affiliation. Sample communities were clustered with a Bray-Curtis similarity measurement based on relative abundance data of each OTU. The dendogram on the y-axis is a neighbor joining phylogram derived from representatives from each OTU at abundances greater than 0.25%. The closest related sequences to OTU 1563 were GenBank accession numbers FJ150820 and HM103762, to OTU 40 is HQ331116 and to OTU 5543 is GQ345917.

