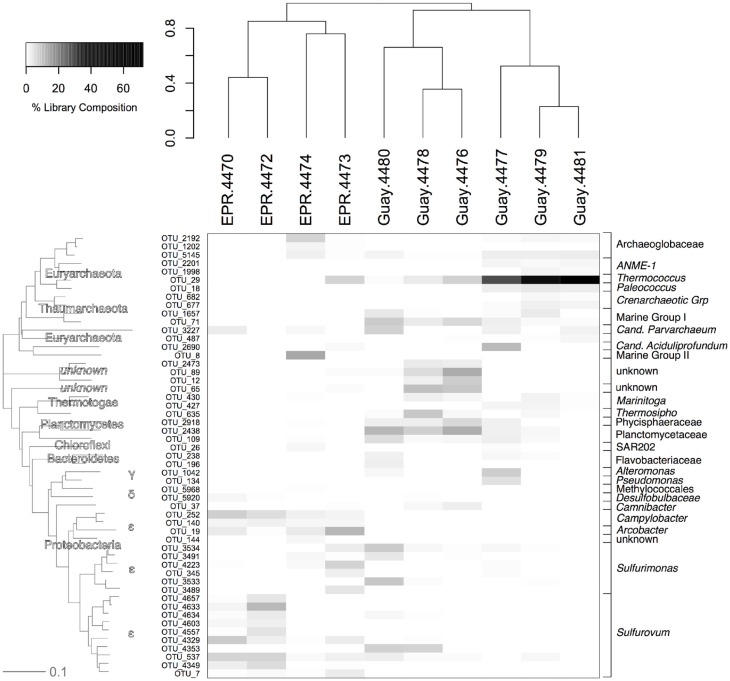
Figure 6.
Relative abundance of OTUs from the vent-specific microbial community of the indicated sample with their corresponding phylogenetic affiliation. Sample communities were clustered with a Bray-Curtis similarity measurement based on relative abundance data of each OTU. The dendogram on the y-axis is a neighbor joining phylogram derived from representatives from each OTU at abundances greater than 0.25%. EPR, 9°N East Pacific Rise; Guay, Guaymas Basin.

