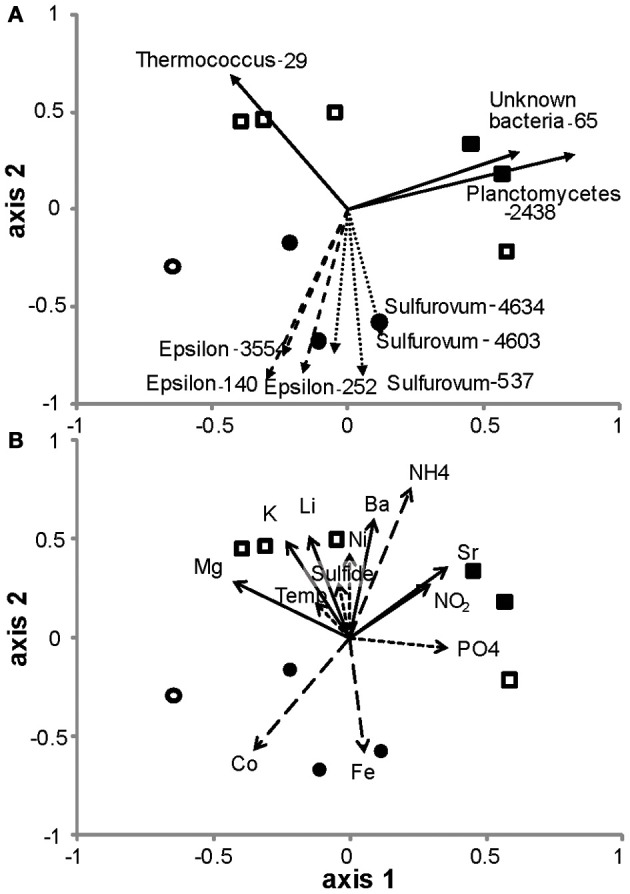
Figure 7.

Non-metric multidimensional scaling plot of hydrothermal vent microbial communities. (A) Vectors of the correlation values from OTUs that most explain the relationships in the plot (r > 0.6, n > 2.0). (B) Vectors of the correlation values from environmental factors that most explain the relationships in the plot (r > 0.2 and <0.4 indicated as dotted lines, r > 0.4 and <0.6 indicated as solid lines and r > 0.6 as dashed lines). Circles, 9°N East Pacific Rise; squares, Guaymas Basin; closed symbols, macrofauna-associated; open symbols, not macrofauna-associated.
