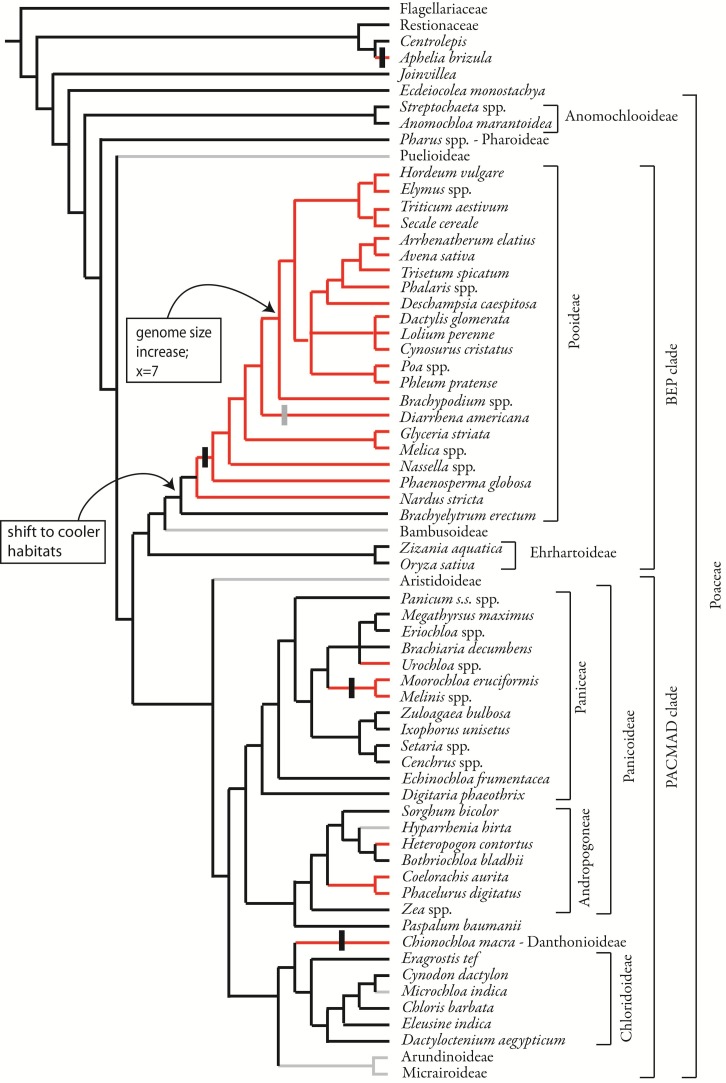
Figure 11.
Phylogenetic distribution of inflorescence phyllotaxis, including data from this study and from the literature. Parsimony optimization is shown but ML optimization is similar. Species relationships based on Quintanar et al. (2007), Saarela et al. (2010), Salariato et al. (2010), and Grass Phylogeny Working Group II, 2012. Vertical black bars indicate the origin of distichous phyllotaxis, a sub-type of two-ranked; vertical gray bar indicates reversion to non-distichous two-ranked phyllotaxis.

