
Figure 5.
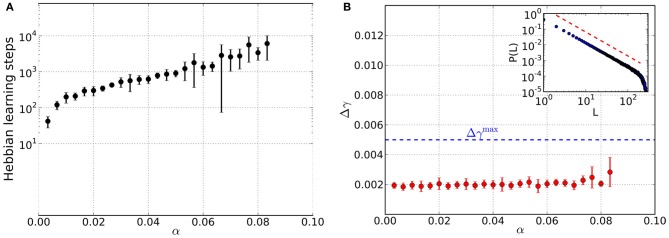
Results from networks that are influenced by Hebbian learning and dynamical synapses, for different values of the load parameter α. For each α data is taken from 10 trials and error bars mark one standard deviation from the mean. (A) Total number of steps in Hebbian learning needed to converge to a state that is both critical and an associative memory of the stored patterns. (B) Average mean squared deviation Δγ from the best-fit power law. Since all data points lie below the threshold of Δγmax = 0.005 (blue dashed line), avalanche size distributions are critical over the whole range of α. The inset shows an example avalanche size distribution P(L) in the converged state and the red dashed line marks the slope of the best-fit power law.