
Figure 2b:
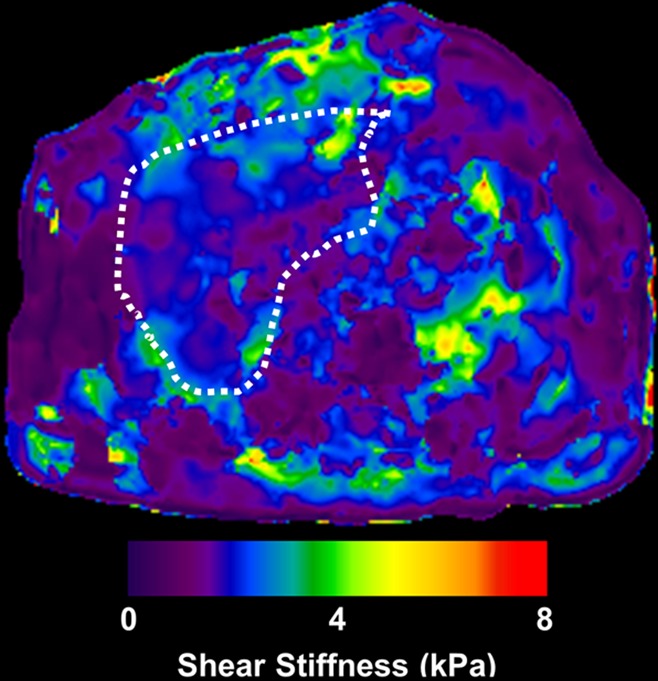
MR elastographic data in a patient with NAFLD without advanced fibrosis. (a) Morphologic MR image as established with biopsy results. (b) MR elastogram (stiffness map) of same section shown in a. The liver outline is shown with a dashed line, and the mean stiffness is 2.1 kPa (within the normal range).