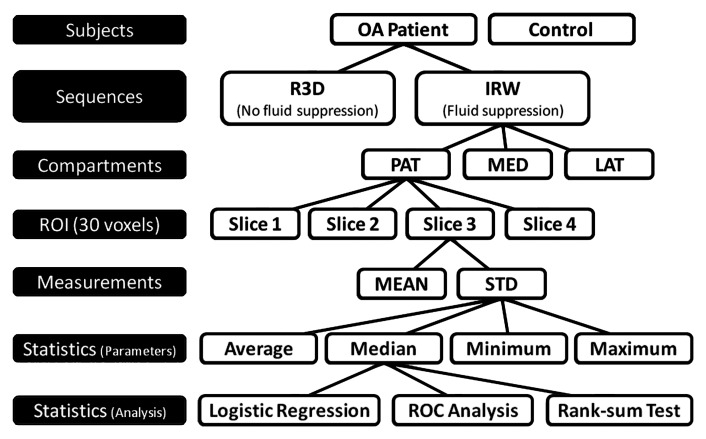
Figure 1:
Acquisition and statistical analysis protocol. ROIs of 30 voxels were drawn in cartilage compartments on four consecutive sections. Mean and standard deviation (STD) of sodium concentration were measured for each ROI of each section. Then, average, median, minimum, and maximum mean and standard deviation were calculated over all ROIs (all sections) and from all compartments for each subject. Logistic regression and receiver operating characteristics (ROC) analyses were applied on latter parameters to differentiate patients with osteoarthritis (OA) from control subjects with radial 3D (R3D) and IR WURST (IRW) sequences. Wilcoxon rank sum test was applied to statistics parameters on osteoarthritis data to assess significance of difference of measures between Kellgren-Lawrence grades. LAT = femorotibial lateral, MED = femorotibial medial, PAT = patellar.

