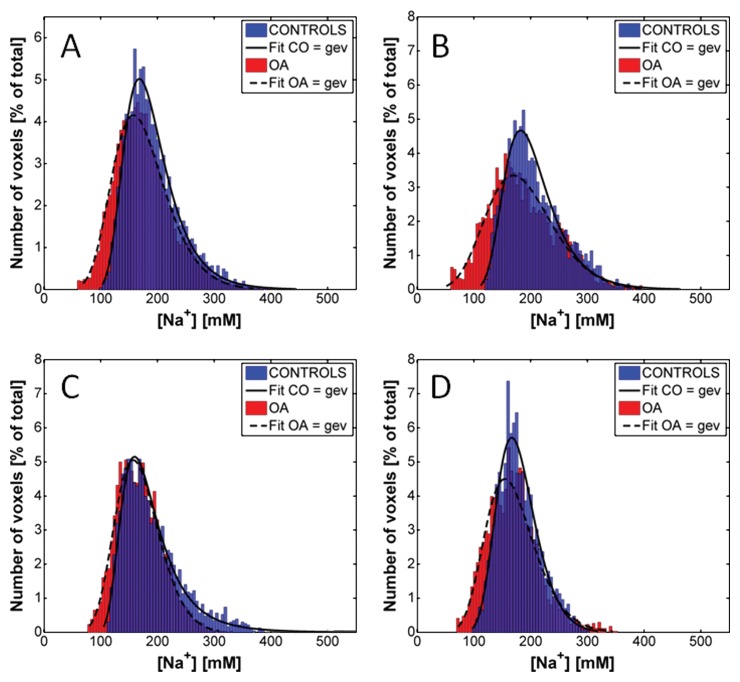
Figure 5:
Distribution of sodium concentrations in all voxels of all ROIs of all subjects with radial 3D sequence (no fluid suppression), for, A, all cartilage compartments and, B, patellar, C, femorotibial medial, and, D, femorotibial lateral compartments. Distributions were fitted by using a generalized extreme value (gev) function as an indicator of their shape for better visualization. Distributions from both patients with osteoarthritis (OA) and control subjects (CO) have a similar shape over same range of sodium concentrations.

