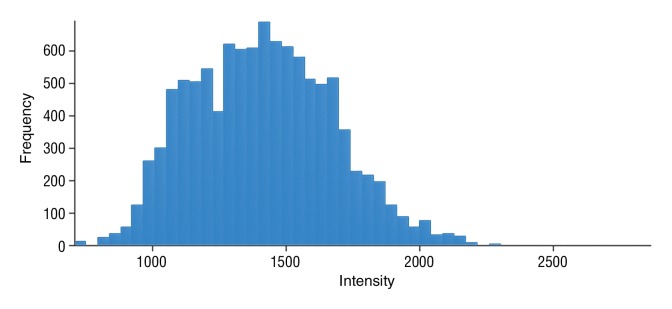
Figure 6b:

Data were obtained in a 62-year-old man with HCC in the validation data set who was stratified as a nonresponder. Before treatment, index lesion RECIST size was 7.8 cm and volume, 80.4 cm3. After treatment, index lesion RECIST size decreased to 6.9 cm, and volume was 65.0 cm3. (a) Color-coded functional ADC map shows segmented tumor before treatment. (b) Histogram shows distribution of ADC values (measured in micrometers per second squared) before treatment. (c) Histogram shows distribution of portal venous enhancement before treatment. (d) Color-coded functional ADC map shows segmented tumor 4 weeks after treatment. (e) Histogram shows distribution of ADC values 4 weeks after treatment. Mean ADC increased from 1.44 × 10⁻³ mm/sec2 to 1.69 × 10⁻³ mm/sec2 (17.4% increase). (f) Histogram shows distribution of portal venous enhancement 4 weeks after treatment. Mean portal venous enhancement increased from 79.3% to 107.2% (35.3% increase).
