
Table 2.
Validation of ADC and Venous Enhancement Thresholds in the Testing Subset (n = 29)
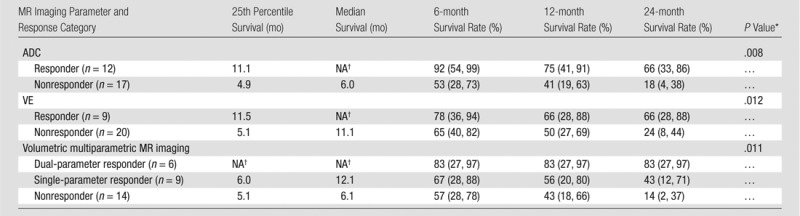
Note.—Data in parentheses are 95% confidence intervals. NA = not applicable.
*
P values were calculated with univariate Cox regression analysis.
†
Survival data could not be calculated due to low number of events in this subgroup.