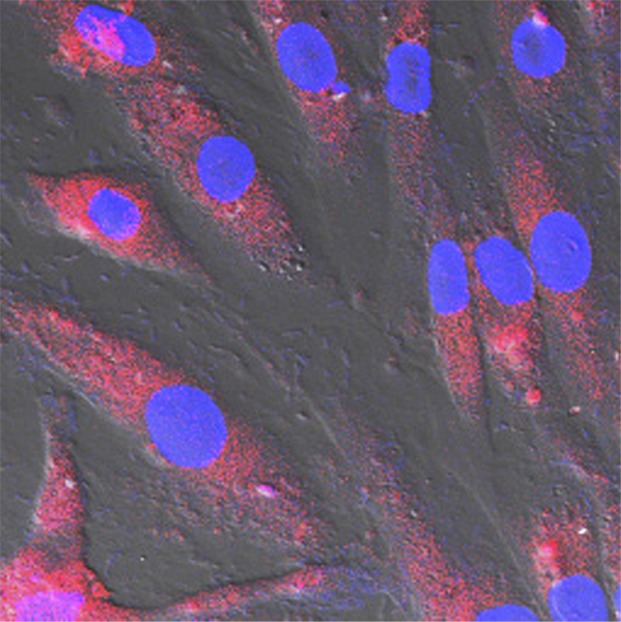
Figure 1a:

(a, b) Confocal microscopic images. MGd-exposed SMCs show (a) red fluorescent spots within the cytoplasm when compared with (b) nonexposed control cells. Blue indicates nuclei. (c) T1 map shows T1 values decrease as MGd concentrations increase. Numbers indicate MGd concentration in micromoles per liter. (d) Average fluorescent signal intensity (SI) and T1 value plotted against MGd concentration for SMCs shows that 150 µmol/L is the optimal concentration, at which signal intensity begins to peak. A.U. = arbitrary units.
