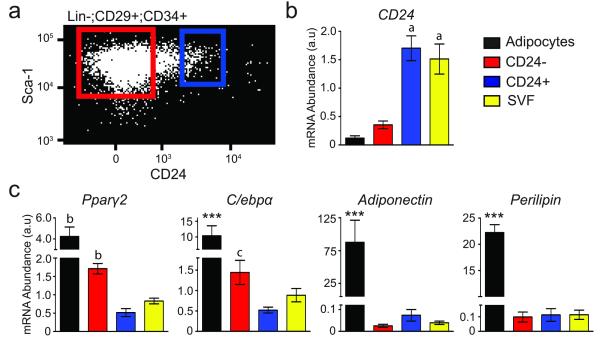
Figure 3.
CD24− cells express late adipogenic genes. (a) A representative dot plot is shown with boxes representing the sort parameters for the CD24+ (blue) and CD24− (red) populations. (b,c) qPCR of CD24 expression, late adipogenic and mature adipocyte specific genes in purified mature adipocytes and FACS isolated cell populations (n=5 RNA extractions from independently isolated cell samples; *** p<0.001 vs. all other populations; a p<0.001 vs. CD24− and adipocytes (Adi); b p<0.001 vs. CD24+ and SVF; c p<0.001 vs. Adi and p<0.05 vs. CD24+; error bars represent S.E.M.).

