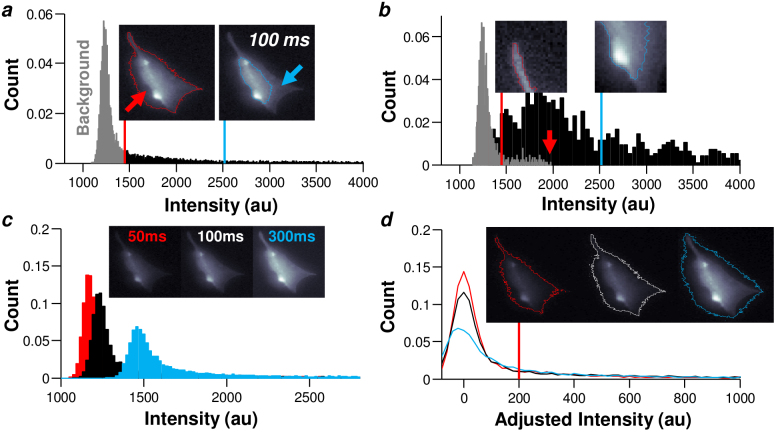
Figure 1. The light signal from a fluorescent cell sample greatly affects digital image intensity profiles.
(a) A histogram of the intensity distribution in a typical fluorescent image of a NIH 3T3 fibroblast is shown. The raw image (both inset) was captured using τ = 100 ms and 1000 bins were used to construct the histogram. A segmentation threshold was calculated using the mixture of Gaussian (MoG) method and plotted as the vertical, red line, separating the histogram into a background class (gray) and the remaining pixel intensities. The boundary that the MoG threshold produces is drawn in red over the left inset image. A second segmentation threshold was calculated using Otsu's method and plotted as the vertical, blue line. The boundary that Otsu's threshold produces is drawn in blue over the right inset image. Arrows indicate important regions of the image that were segmented differently by each method. (b) Histograms of cropped images from two regions in the raw cell image are shown. The cropped image of one cell protrusion (left inset) produces a histogram (gray) with a background class of pixels and small ‘tail' corresponding to the cell protrusion signal. The boundary of a MoG threshold is shown. The cropped image of the cell body (right inset) also produces a histogram (black) with a background class and a tail. The boundary of an Otsu threshold is shown. The peak intensity (arrow) for the cropped image of the protrusion falls into the background pixel class of the cell body histogram. (c) The intensity profile of a fluorescent image changes depending on the exposure time (τ) during image acquisition. Images taken at τ = 50, 100 and 300 ms (inset) generated histograms colored in red, black and blue, respectively. As τ increases, the average image intensity also increases and the background class appears to develop a wider and shorter intensity distribution. (d) The average background intensity of each different exposure was subtracted to adjust the intensity of each histogram for comparison. A threshold (vertical red line) was chosen by eye to segment each adjusted image (inset).

