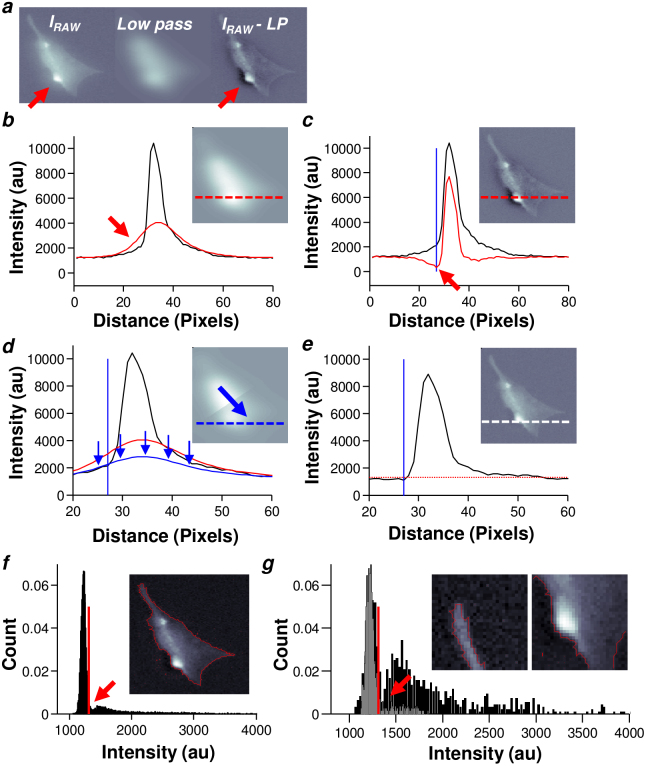
Figure 2. Subtraction of a re-scaled spatial low pass result from a raw image drastically improves subsequent segmentation.
(a) Three images are shown: a raw fluorescence image (left), the result of applying a spatial low pass filter to the raw image (middle), and the result of subtracting the low pass image values from the raw image values (right), which produces a sharpened image, increasing contrast at the edges of the cell (arrows). (b) Selected intensity profiles for the raw image (black) and the low pass result (red) are plotted according to the index of the global minimum in the sharpened image. Part of the low pass intensity profile exceeds the raw image intensity (arrow). (c) Once the low pass result is subtracted from the raw image values (black), the sharpened image intensity profile (red) will contain a global minimum (red arrow). The vertical blue line demonstrates the index of the minimum point in the sharpened image. (d) The ratio of values between the raw (black) and low pass (red) image at the pixel index corresponding to the global minimum (vertical blue line) is set as a scale factor to reduce the intensity of the low pass result (blue arrows). The scaled low pass result (blue curve) now appears to ‘fit' below the raw image intensity profile. (e) Subtraction of the scaled low pass result from the raw image values generates a new profile (black) drastically improving the ability to perform segmentation by a single MoG threshold (red dotted line). This process treats the index of the global minimum (vertical blue line) as part of the background since the value of the final image at that point equals the mean background intensity. (f) After processing, the histogram of the final image appears to feature two distinct distributions (arrow). The boundary that a MoG threshold (vertical red line) generates is shown (inset). (g) Histograms of two cropped regions in the final image are shown. Both the cropped image corresponding to one cell protrusion (left inset) and part of the cell body (right inset) can now be segmented by a single MoG threshold.

