
Figure 3. Automated segmentation is robust and accurate.
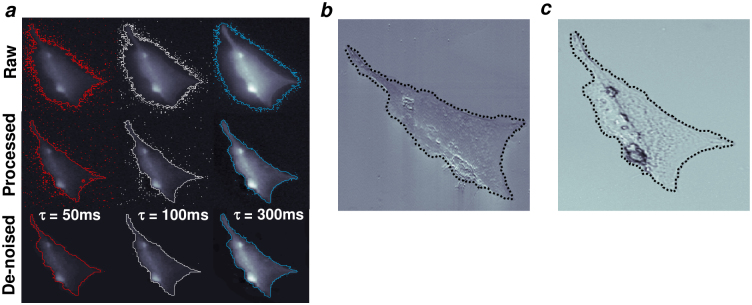
(a) Fixed cells imaged using progressively longer exposure times generate progressively brighter images. A MoG threshold was used to segment each image and generate cell boundaries (top row) for images taken at τ = 50, 100 and 300 ms, colored red, white and blue, respectively. Each image was processed using the developed spatial filtering method and segmented by MoG thresholds to generate cell boundaries (middle row). Pixel noise remained an issue after processing, especially for dimmer images with less signal-to-noise ratio. Application of a de-noise algorithm (anisotropic diffusion) to the processed images before segmentation attenuated the pixel noise and greatly enhanced the final cell boundaries. (b) Variable pressure scanning electron microscopy (vpSEM) was performed to image cell samples at a higher resolution than fluorescence microscopy is capable without a coating such as gold. Segmentation was performed on raw images of the fluorescence signal (τ = 100 ms) based on the developed approach. The boundary of that segmentation was scaled and rotated to match the length scale of the vpSEM image and overlaid onto it (dotted black line). (c) Dynamic interference contrast (DIC) microscopy was performed to capture an image of the cell sample for further comparison. The same boundary generated from analysis of a fluorescence image was scaled to the length scale of the DIC image and overlaid onto it.