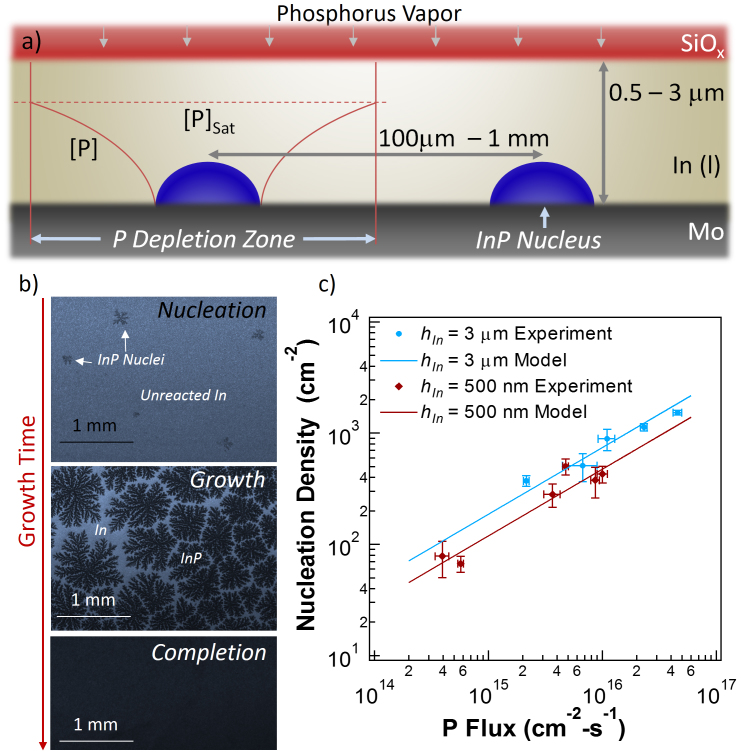
Figure 3. Growth schematic.
(a), Qualitative diagram of the TF-VLS growth process, showing the phosphorous vapor diffusing through the cap layer, initial InP nucleus, and phosphorus concentration [P] as a function of distance from the nucleus. The depletion zone is defined as the area where [P] < [P]Sat. (b), Optical microscopy images of the growth of the InP films. Initially, separate InP nuclei/islands form, followed by growth outwards in a dendritic fashion. Finally, separate InP islands converge together and growth completes as the In film turns into InP. (c), Nucleation density as a function of incident P flux for two different starting In film heights.

