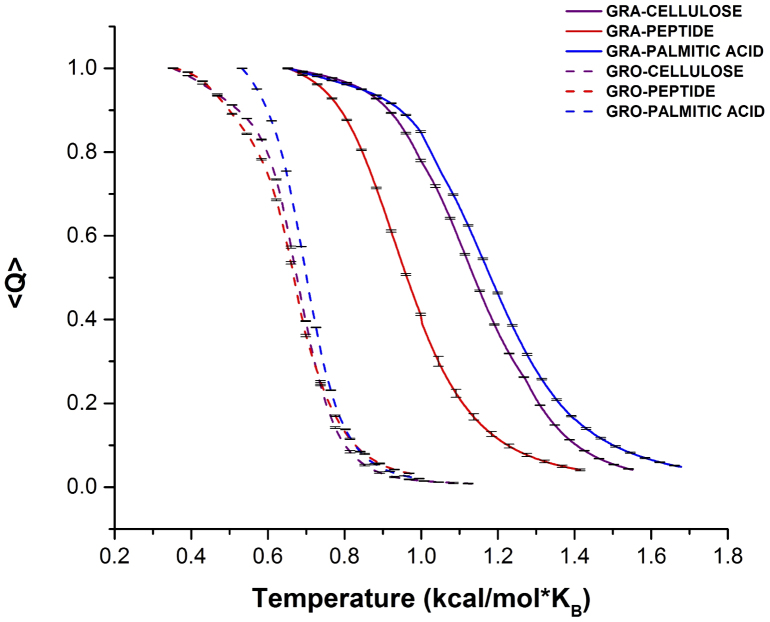
Figure 3. Differential binding affinities of natural amphiphiles with graphene derivatives.
The average value of normalized fraction of contacts, <Q>, was computed as the function of temperatures (T*) using the weighted histogram analysis method with replica exchange DMD simulations (Methods). The error bars were computed as the statistical uncertainty47. The temperature dependence of <Q> values illustrates the melting. For each of the three amphiphile species, the melting curves of both graphene oxide (“GRO”, dashed) and graphene (“GRA”, solid) are shown.

