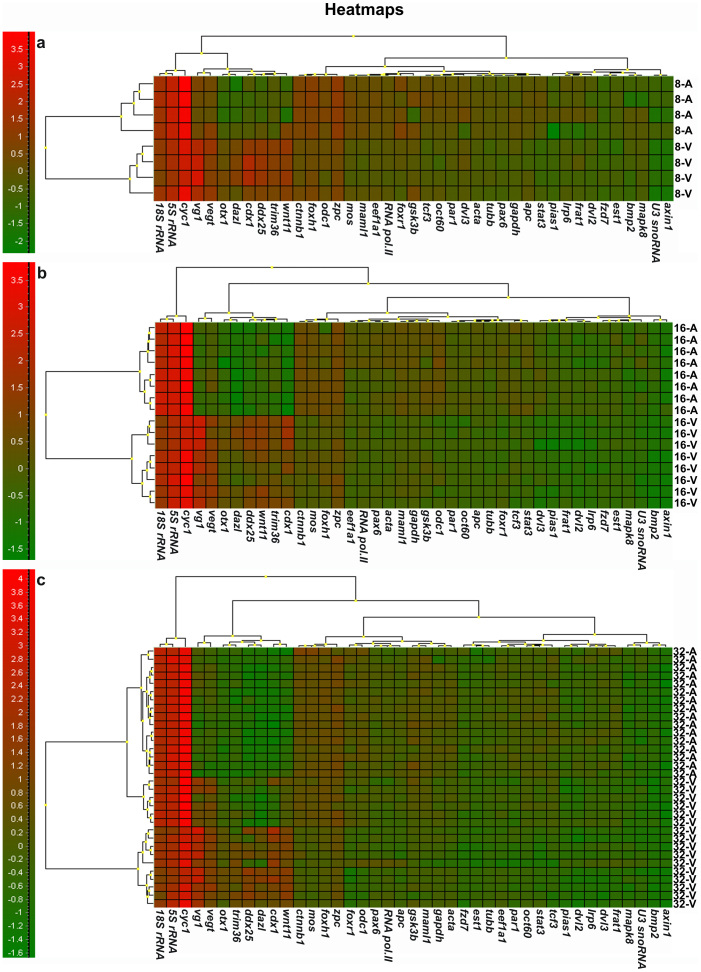
Figure 2. Hierarchical clustering of blastomeres and mRNAs of Xenopus laevis early embryos presented as heatmaps.
One embryo from each developmental stage was arbitrarily chosen for the cluster analysis. (A) 8-cell, (B) 16-cell and (C) 32-cell embryo. Green color indicates low expression and red high expression. The dendrograms clustering blastomeres and genes are shown in the top and left side of the heatmap, respectively. In the dendrograms similarity between blastomeres/genes is indicated by the height at which they are joined.

