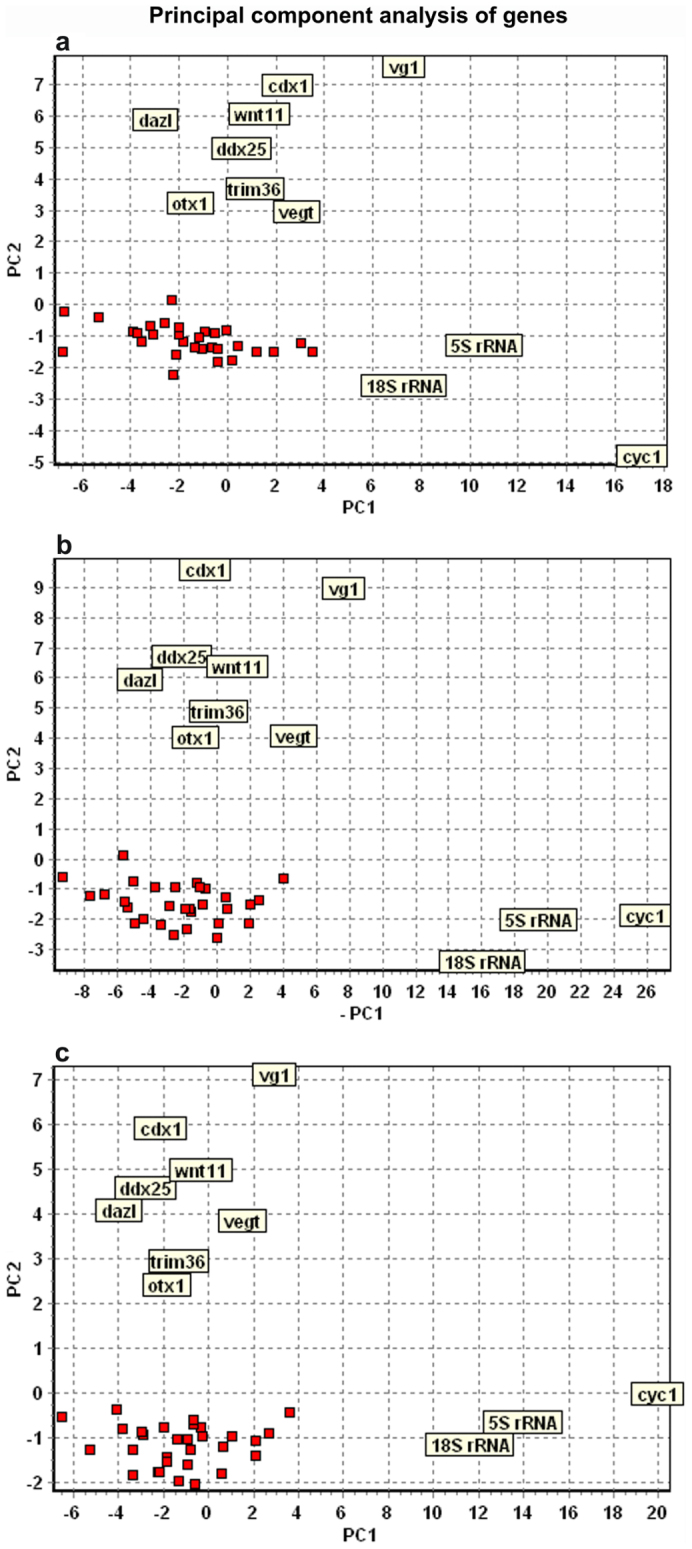
Figure 3. Principal component analysis of maternal genes.

(A) 8-cell stage (four embryos/32 cells analyzed), (B) 16-cell stage (four embryos/64 cells analyzed), and (C) 32-cell stage (32 cells analyzed) embryos. Three clusters are seen in all the developmental stages. First cluster comprises 18S rRNA, 5S rRNA, and cyc1(mitochondrial cytochrome c); second cluster vg1, cdx1 (xcad2), wnt11, dazl, vegt, ddx25 (deadsouth), otx1, and trim36; third cluster (red squares) fzd7, par1, bmp2, pias1, dvl2, dvl3, lrp6, foxr1, fart1, mapk8, odc1, axin1, est1, U3 snoRNA, apc, gapdh, acta, eef1a1, tcf3, zpc, RNA polymerase II, gsk3b, maml1, tubb, ctnnb1 (β-catenin), mos, oct60, foxh1, stat3, and pax6. The animal-vegetal distinction is found along the y-axis (PC2), while differences in expression level of the maternal transcripts is reflected along the x-axis (PC1).
