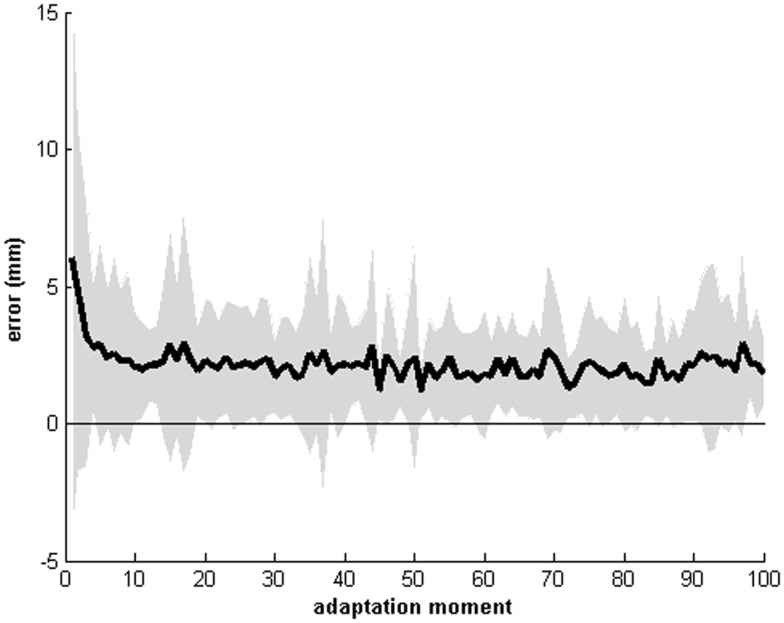
Figure 2.
Mean recordings of the pointing movements of all 33 patients for the first 100 pointing movements. The horizontal axis displays the moment of pointing (0 till 100), the vertical axis displays the error displacement of either the right, left, or central target. Shaded area indicates the mean standard deviation. Note that the absolute center of each target (x, y coordinate) was used as the referent.

