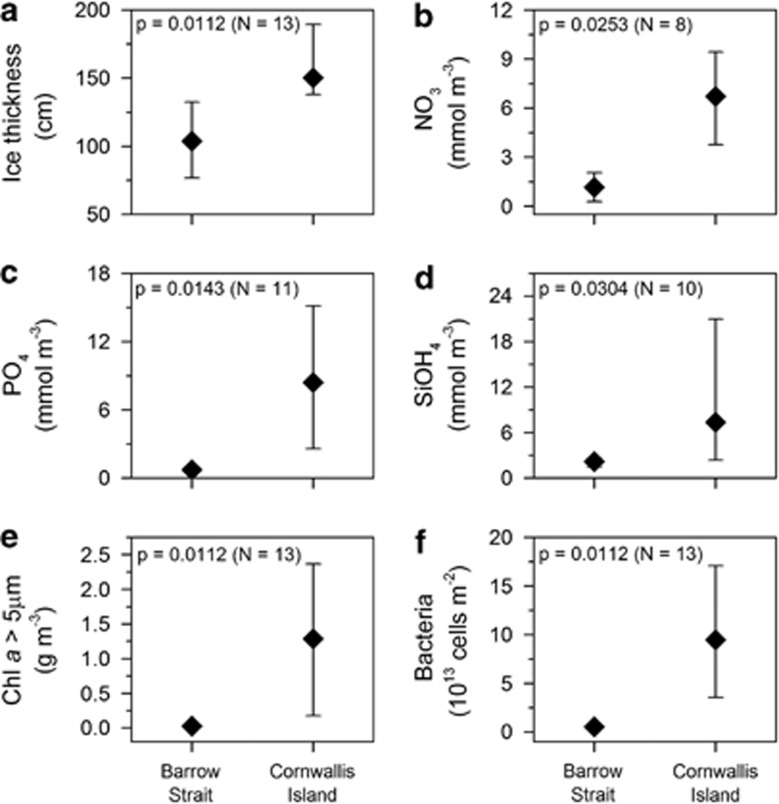
Figure 2.
Comparison of (a) ice thickness, (b) NO3 concentration, (c) orthophosphate concentration, (d) silicate concentration, (e) chl a (fraction >5 μm) concentration and (f) bacterial numbers measured in bottom sea ice at stations in Barrow Strait and in the vicinity of Cornwallis Island. Significance level (P) from Mann–Whitney U-test, and number of observations (N) are indicated.

