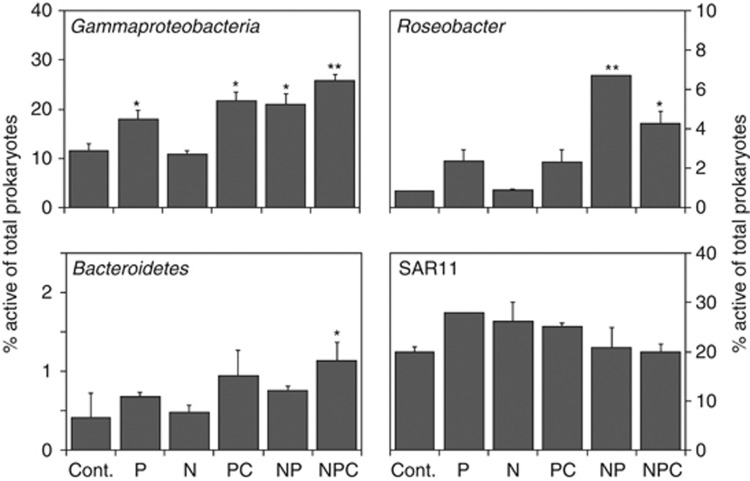
Figure 2.
Percentage of active cells within each probe-identified group in relation to total prokaryotes (DAPI counts). Labels as defined in Figure 1. Asterisks denote significant differences in relation to the control (*P<0.05, **P<0.001). Note the different y axis scale for Roseobacter and Bacteroidetes.

