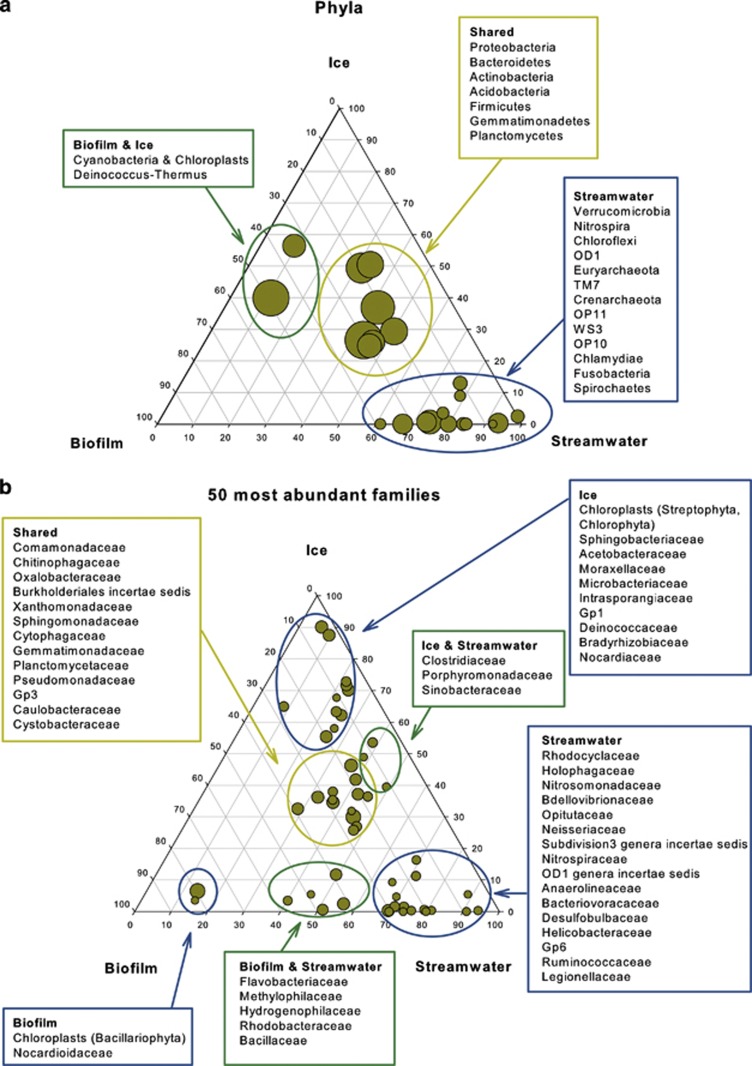
Figure 2.
Distribution of taxonomic groups in glacial ice, streamwater and biofilm. The percentage of (a) phyla and (b) the 50 most abundant families associated with each habitat is visualised in ternary plots. The position in the triangle indicates the relative abundance of each taxon among the three habitats; the size of the circle represents the relative abundance of taxa.

