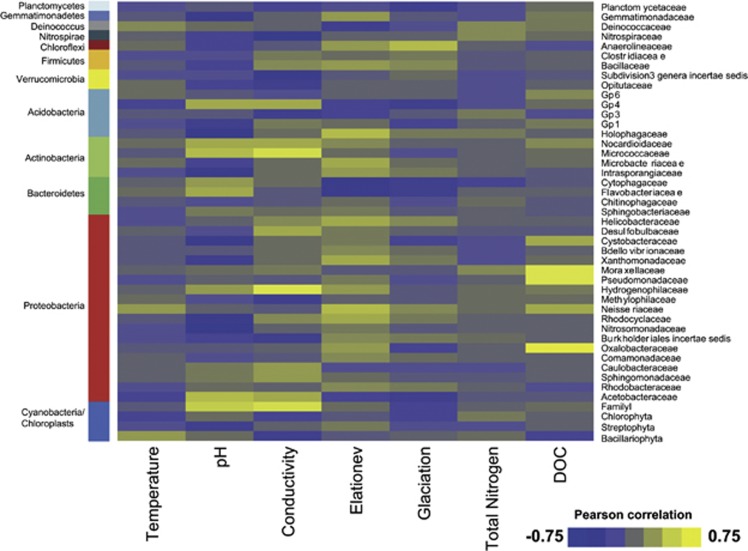
Figure 3.
Heat map of Pearson correlations between environmental variables and families detected in biofilms. Colours represent the r-values of Pearson correlations between relative abundances of the 45 most abundant bacterial families and environmental parameters. Families were ordered according to taxonomic affiliations. We found several families that were strongly correlated to pH and electrical conductivity. Positive correlations with DOC were only found with Proteobacteria. Streamwater temperature and total nitrogen were only weakly related to the abundance of taxonomic families.

