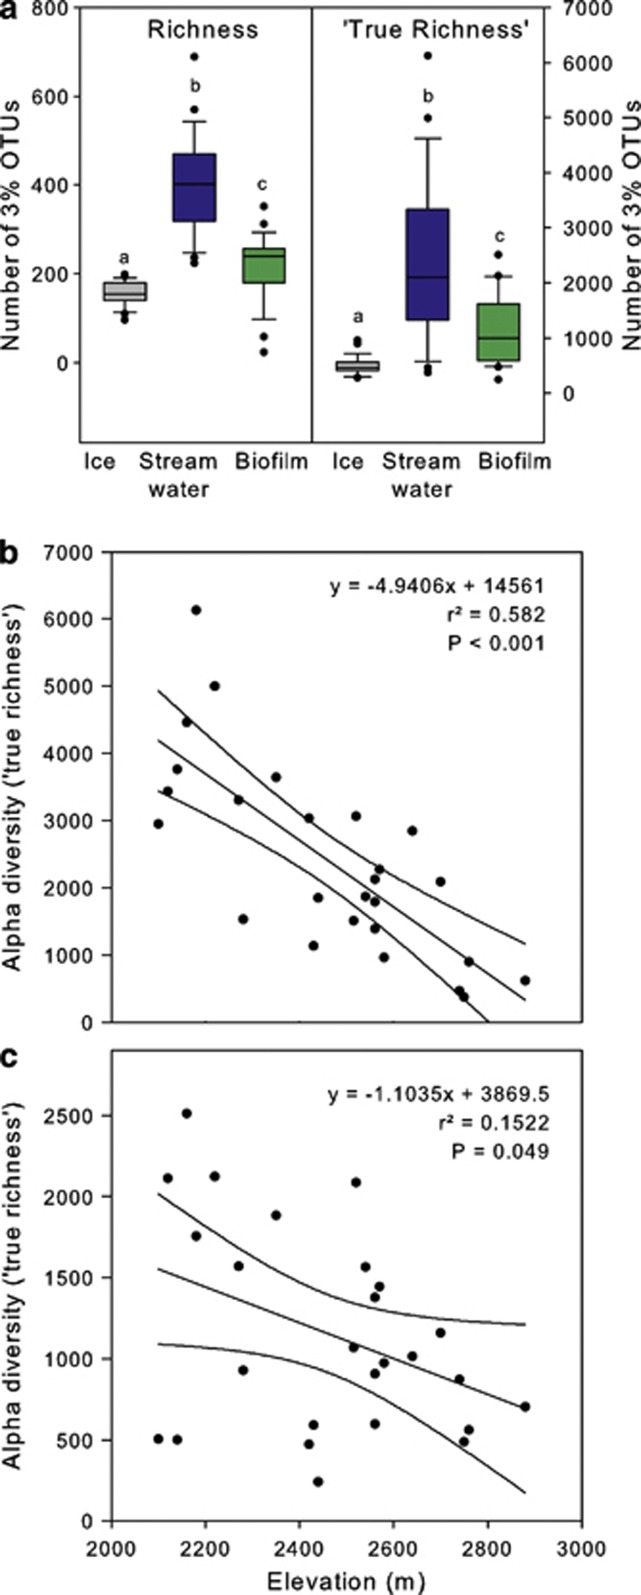
Figure 4.
Microbial α diversity. (a) Boxplot representation of rarefied richness (all samples rarefied to 1007 reads) and ‘true richness' estimated by fitting Sichel distribution curves to the abundance distributions obtained from the 454-pyrosequencing data. Median (line), 1st and 3rd quartile (box margins), 5 and 95% percentiles (whiskers), outliers (points). Different letters on each box represent significant differences between habitats as determined by Wilcoxon tests followed by Bonferroni correction (P<0.01). (b,c) Microbial richness decreased with higher elevation. Linear regression include 95% confidence intervals in the (b) streamwater and (c) biofilms.

