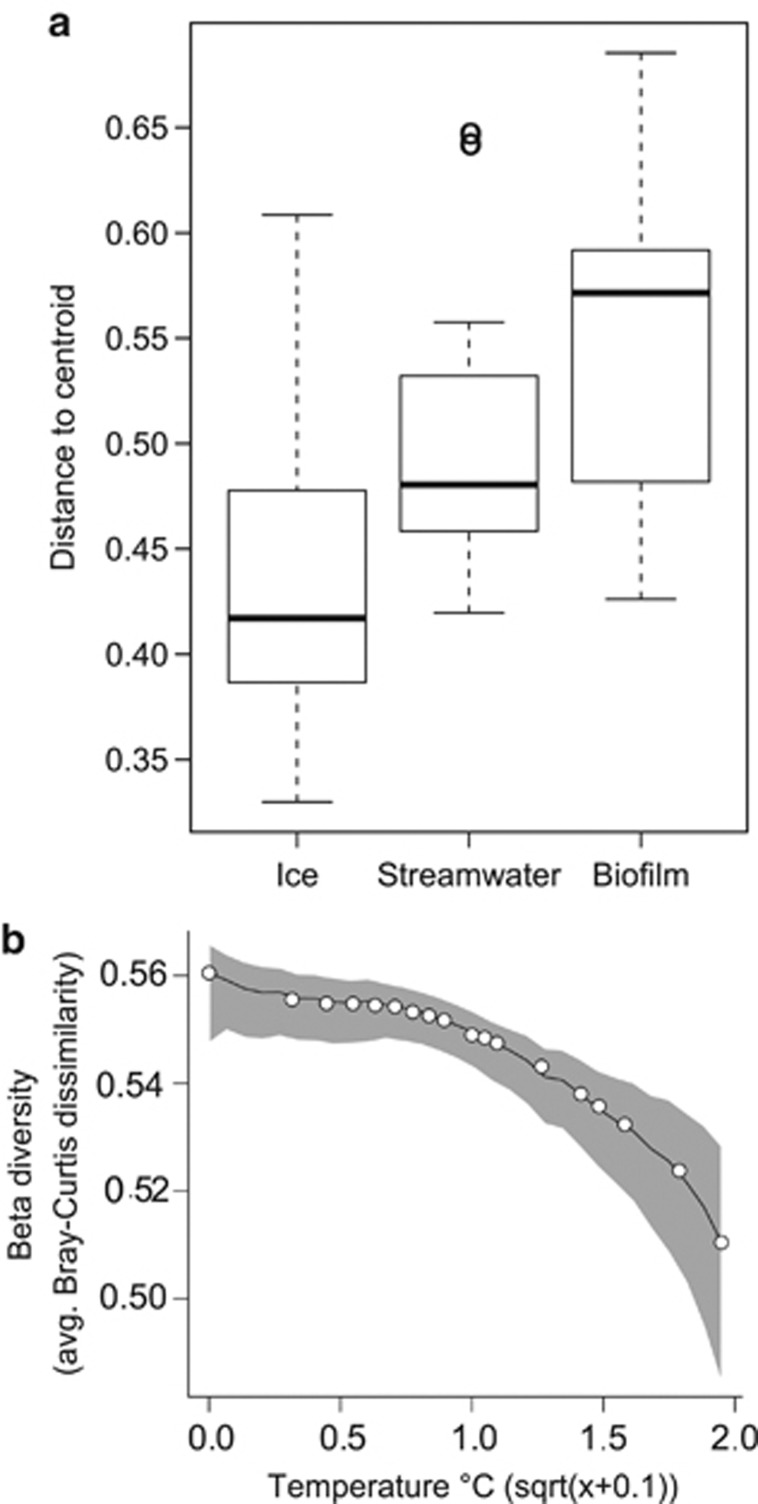
Figure 5.
Spatial variation of microbial communities. (a) β diversities of the three habitats as the average distance of communities to the group (that is, habitat) centroid after principal coordinate analysis of the Bray–Curtis dissimilarity matrix. β diversity differed significantly among habitats (pseudo-F=17.082, d.f.1=2, d.f.2=75, P<0.001 for all pairwise comparisons). (b) Graphical analysis of biofilm β diversity as a function of streamwater temperature by local polynomial regression fitting. Multiple linear regression on distance matrices revealed β diversity to decline significantly with increasing streamwater temperature (pseudo-t=−4.77, P<0.05). The shaded area gives a bootstrap confidence interval for the generated trendline. See Materials and methods and Supplementary Information for computational details.

