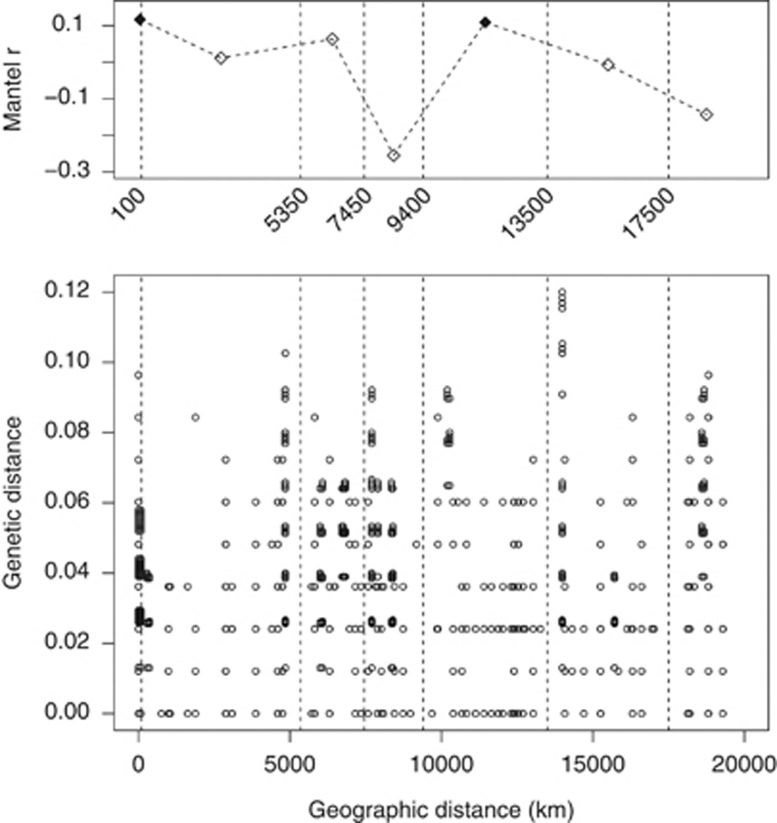
Figure 4.
Genetic distance among Polaromonas sequences by geographic distance between glaciers. Lower panel shows all pairwise comparisons of genetic distance among Polaromonas sequences (n=4753) and geographic distance among glaciers (n=17). Upper panel shows the Mantel correlogram of genetic distance among the same sequences separated in six distance classes. The midpoint of each distance class is plotted. Shaded diamonds indicate significant tests in the Mantel correlogram. Vertical dashed lines indicate breakpoints between distance classes. The small numbers between the panels indicate the exact position of breakpoints.

