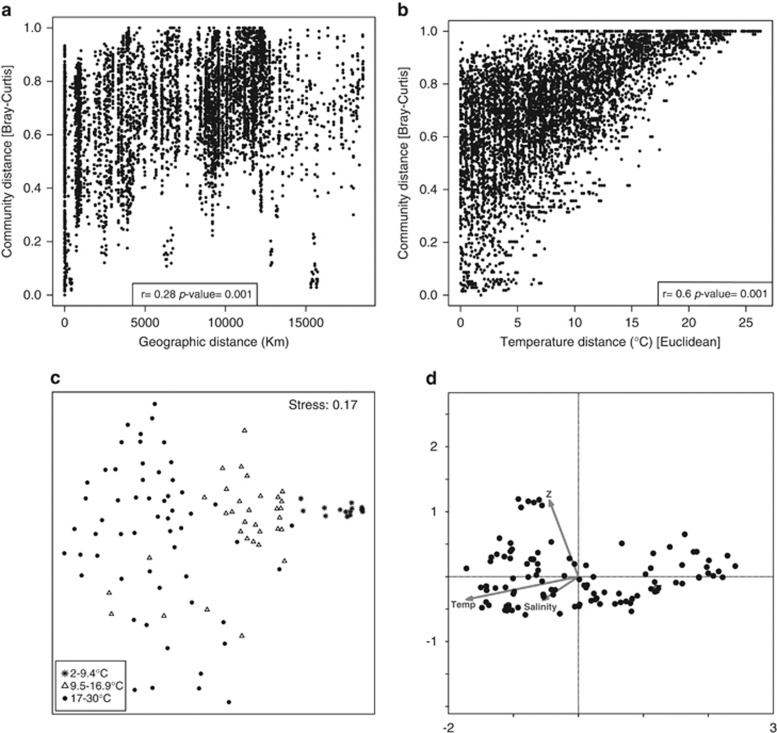
Figure 5.
Analysis of the global data set of ARISA fingerprints for MAST-4 diversity. (a) Plot comparing community distances (calculated from the OTU-table) and geographic distances among samples, together with the Mantel test statistic r. (b) Plot comparing community and environmental (temperature) distances, together with the Mantel test statistic r. (c) NMDS diagram displaying each sample as a function of their community distances. Different symbols represent the temperature grouping. (d) Constrained Correspondence Analysis diagram displaying each sample in function of their community distances and constrained for the three most important factors: temperature (Temp), salinity (Sal) and sampling depth (Z). Arrows represent the direction and magnitude of the environmental factor gradient.

