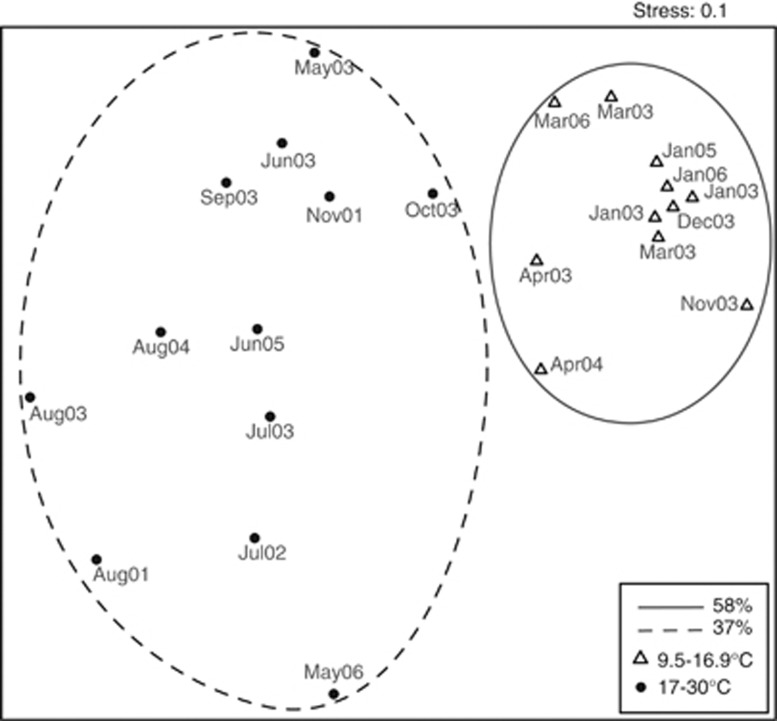
Figure 7.
NMDS analysis of ARISA fingerprints in the temporal study at Blanes Bay. Samples are displayed with symbols for temperature as in Figure 5 and with the date of sampling (month–year). Points enclosed by dashed and solid lines cluster at 37% and 58% similarity, respectively, in a separate dendrogram (not shown).

