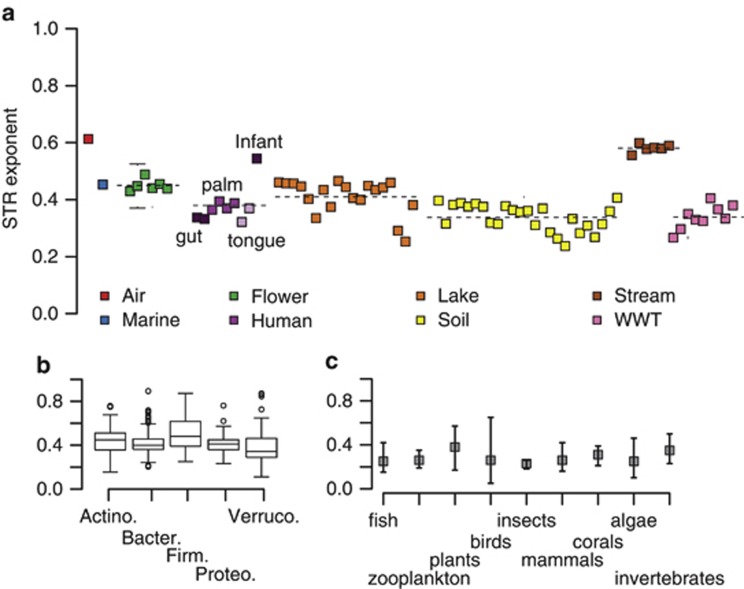
Figure 5.
STR exponent, w, from power-law fit to the accumulation of taxa detected with time, as per White et al. (2006). (a) Microbial community STR across habitats. The dashed line indicates the average exponent value for each habitat. Error bars are s.e. but, in most cases, are too small to visualize on the chart. WWT is brewery wastewater treatment. (b) Microbial STR exponent for phyla detected across all habitats: Actinobacteria, Bacteroidetes, Firmicutes, Proteobacteria and Verrucomicrobia. White circles are samples that had STR values beyond range times the interquartile range (potential statistical outliers). (c) Average STR exponent by taxonomic group for larger organisms, reproduced from Figure 3 of White et al. (2006). Error bars are exponent ranges for each taxonomic group.

