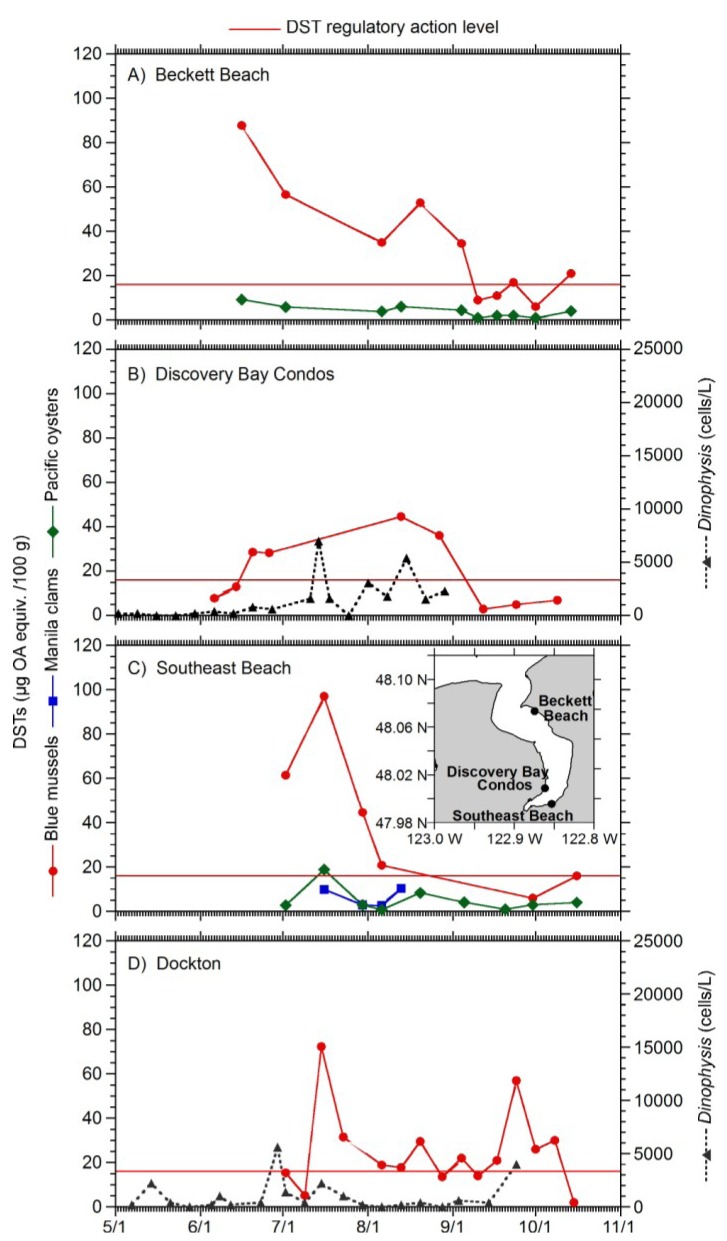
Figure 3.
Total DSTs in blue mussels and Pacific oysters at Beckett Beach (A); blue mussels at Discovery Bay Condos (B); and blue mussels, manila clam, Pacific oyster at Southeast Beach (C). Discovery Bay (Figure 1A) monitoring locations are shown (C, inset). Total DSTs in blue mussels at Dockton (Figure 1A; D). The left y-axis depicts total DSTs in shellfish (μg OA equiv/100 g) and Dinophysis abundance is shown in the right y-axis (cells/L).

