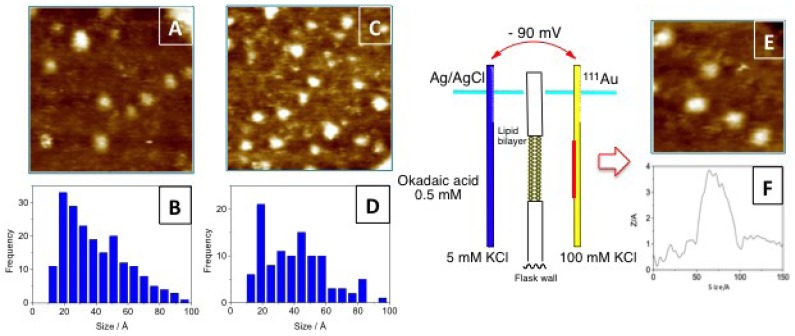
Figure 3.
(A) STM image of an okadaic acid (OA) sample and (B) its corresponding histogram of size distribution. (C) and (D) are the corresponding figures of okadaic acid in a KCl solution. On the right side of the figure, a schematic representation of the experimental setup used to monitor the flux of OA through a lipid bilayer. (E) corresponds to a section of the gold plate used to monitor the experiment and (F) is the cross section of one spot.

