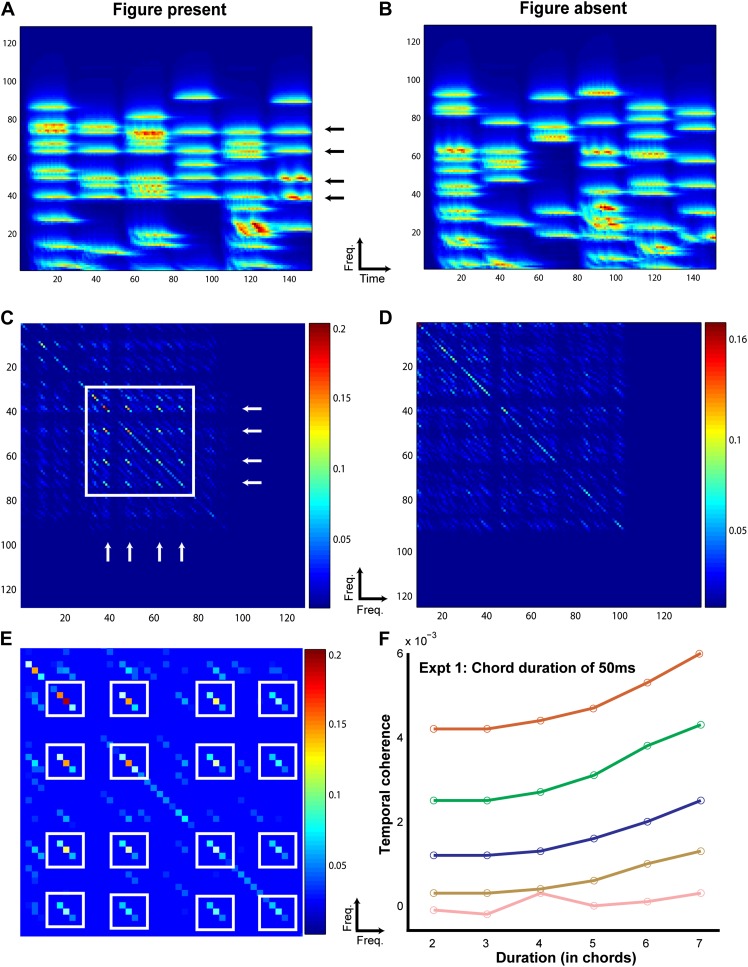
Figure 3. Temporal coherence modeling of SFG stimuli.
The protocol for temporal coherence analysis is demonstrated here for experiment 5. The procedure was identical for modeling the other experiments. A stimulus containing a figure (here with coherence = 4) as indicated by the arrows (A) and another, background only (figure absent) stimulus (B) was applied as input to the temporal coherence model. The model performs multidimensional feature analysis at the level of the auditory cortex followed by temporal coherence analysis which generates a coherence matrix for each stimulus as shown in C and D respectively. The coherence matrix for the stimulus with figure present contains significantly higher cross-correlation values (off the diagonal; enclosed in white square) between the channels comprising repeating frequencies as indicated by the two orthogonal sets of white arrows in C. A magnified plot of the coherence matrix for the figure stimulus is shown in E where the cross-correlation peaks are highlighted in white boxes. The strength of the cross-correlation is indicated by the heat map next to each figure. The stimulus without a figure, that is, which does not contain any repeating frequencies, does not contain significant cross-correlations. This process is repeated for 500 iterations (Niter) for all combinations of coherence and duration. The differences between these two coherence matrices were quantified by computing the maximum cross-correlation for each set of coherence matrices for the figure and the ground stimuli respectively. Temporal coherence was calculated as the difference between the average maxima for the figure and the ground stimuli respectively. The resultant model response is shown for each combination of coherence and duration in F.


