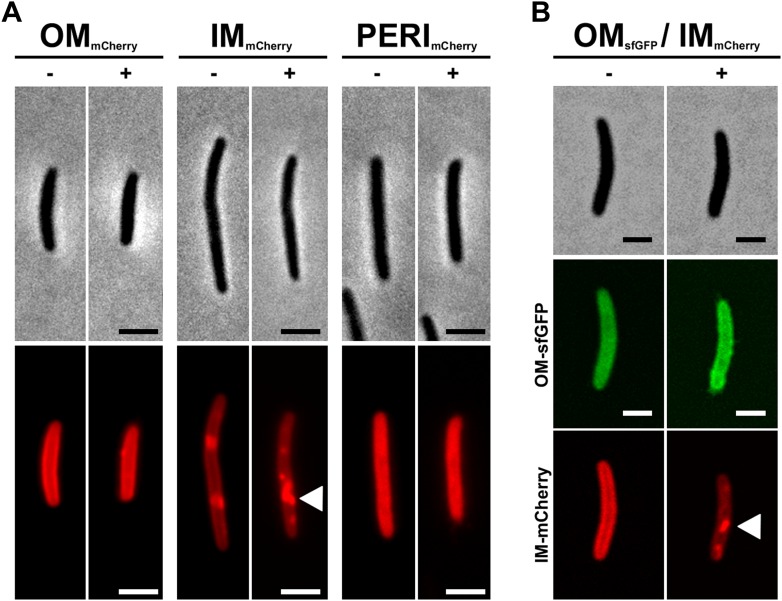
Figure 1. Transfer is a highly efficient OM-specific process.
(A) Percentage of mCherry+ recipient cells as a function of time. For each strain and time point, at least 3000 cells were analyzed in triplicate. Error bars = SD. (B) Fluorescence intensity of mCherry+ recipient cells as a function of time. For each time point, the fluorescence numbers are expressed as a percentage of the mean fluorescence intensity of the donor cells population. For each time point, fluorescence intensities were measured for ∼3000 cells per strain. (C) Distribution of fluorescence intensities measured in the positive recipient cells after 12 hr (green bars) and 36 hr (orange bars) of co-incubation. Note the logarithmic scale log(Fluorescence Intensity). The black arrow highlights the appearance of a highly-stained cell sub-population of mCherry+ cells at 36 hr. For each time point, fluorescence intensities were measured for ∼3000 cells per strain.


