. 2013 Jul 23;2:e00868. doi: 10.7554/eLife.00868

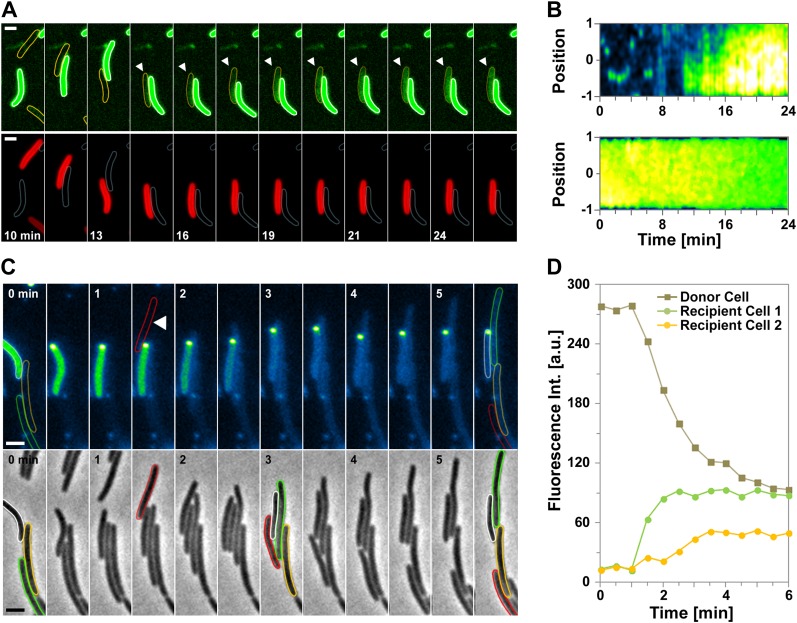
Figure 2. Cell-contact-dependent transfer of OMsfGFP/DiO between single cells.

(A) sfGFP transfer from a donor OMsfGFP+ (white contour in lower panel) cell to a recipient OMsfGFP IMmCherry+ cell (orange contour in upper panel). Scale bar=1 µm. (B) Kymographs of green fluorescence intensities in the positive recipient cell (top) and the donor cell (bottom) shown in (A). Note that in the recipient cell, green fluorescence diffuses from one half (t12min to t16min) to the entire cell body. The Y-axis of each kymograph represents the relative position along the cell body, where 0 represents mid-cell and 1 or −1 the cell poles. The −1 pole is the pole closer to the bottom of the frames for each cell shown in panel (A). (C) A DiO+ cell (white cell contour) transfers DiO to two unlabeled cells (orange and green contours). Fluorescence and corresponding phase contrast images are shown. Fluorescence fluctuations are shown in pseudo colors where high fluorescence levels appear yellow-green and low fluorescence levels appear blue. Note that the green cell is not immediately in contact with the DiO+ cell. A cell that comes in contact with the DiO+ cell but does not become labeled is shown by a red contour. Scale bar = 1 µm. (D) Mean DiO fluorescence intensity over time in the donor cell (gray square), the first positive recipient cell (green circle) and the second positive recipient cell (orange circle).

DOI: http://dx.doi.org/10.7554/eLife.00868.005

Figure 2.

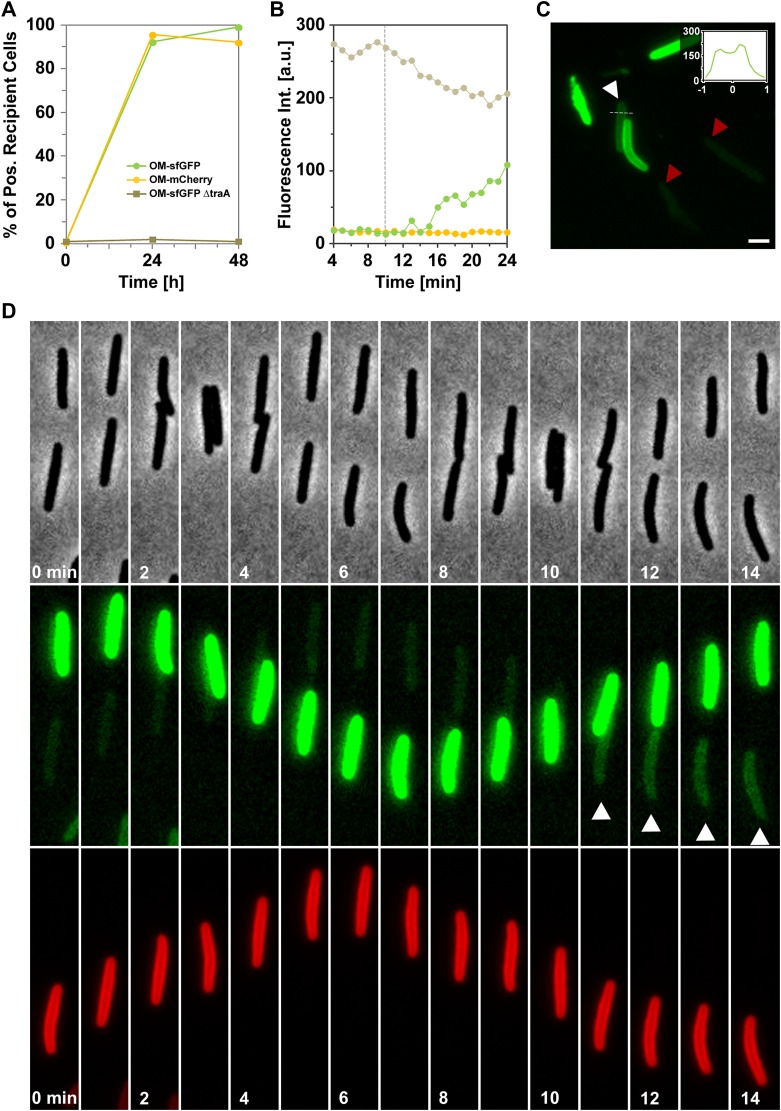
Figure 2—figure supplement 1. Cell-contact-dependent transfer of OMsfGFP.

Figure 2—figure supplement 1.

(A) OMsfGFP is transferred in a traA dependent-manner. The transfer kinetics of OMmcherry are also shown for comparison. The percentage of fluorescent recipient cells is plotted as a function of time. For each condition and time point, at least 3000 cells were analyzed in triplicate. (B) Mean green fluorescence intensities of distinct cell types over time, donor cell (gray circle), the positive recipient cell (green circle) and a negative and isolated recipient cell (orange circle) observed in Figure 1D. The dashed line represents the time when the donor and recipient cells establish contact. (C) Peripheral membrane staining of the recipient cell shown in Figure 1D (white Arrow). For comparison, the red triangles indicate OMsfGFP recipient cells (red triangle) showing no significant level of green fluorescence during the time course. The inset shows a trans-section fluorescence scan. The Y-axis represents the fluorescence intensity and the X-axis represents the relative position along the scan represented by the dashed line. (D) OMsfGFP transfer upon transient cell contact between a donor OMsfGFP+ and a recipient IMmCherry+ cell. Note that OMsfGFP transfer is only observed during the second contact between the donor and the recipient cells (white arrow). Scale bar = 1 µm.