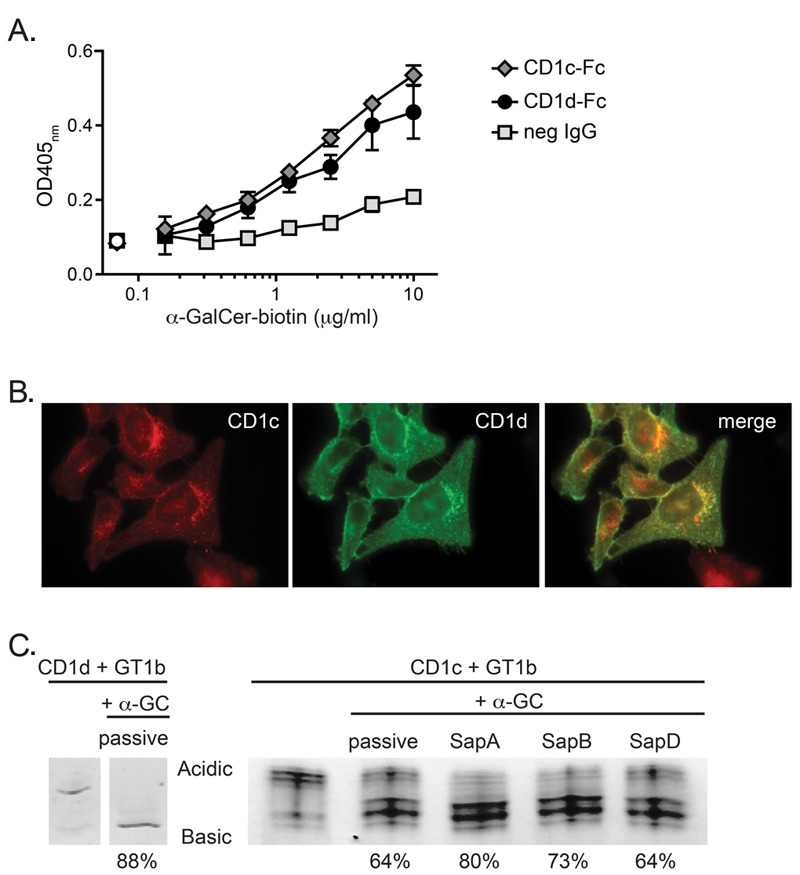
Figure 2. Ability of CD1c to access and bind α-GalCer molecules. (A) Binding of α-GalCer to CD1c and CD1d. Microtiter plates coated with CD1c-Fc or CD1d-Fc fusion proteins or an isotype-matched negative control mAb (neg IgG) were incubated with PBS/BSA solutions containing the indicated concentrations of biotinylated α-GalCer (shaded symbols). Open symbols on the left show the assay backgound from wells that were incubated with PBS/BSA alone. The amount of biotinylated α-GalCer captured on the plate in each condition was detected using a streptavidin-enzyme conjugate; for any given biotin-α-GalCer concentration, the difference between the streptavidin signal obtained from wells coated with CD1-Fc molecules and those coated with negative control IgG is considered to indicate specific binding of the biotinylated α-GalCer to CD1 molecules. Error bars (not always visible on the scale shown) show the standard deviations of the means. Data are representative of 6 independent experiments. (B) Intracellular co-localization of CD1c and CD1d. HeLa cells stably transduced with both CD1c and CD1d were analyzed by immunofluorescence microscopy. The left panel shows the CD1c staining (red), the middle panel shows CD1d staining (green), and the right panel shows the two superimposed. (C) Impact of saposins on α-GalCer loading into CD1c molecules. Recombinant CD1d or CD1c molecules were preloaded with the ganglioside GT1b, then purified CD1-lipid complexes were incubated with a 4.5-molar excess of α-GalCer alone (passive loading) or in the presence of the indicated saposin proteins. Native isoelectric focusing was performed to visualize displacement of GT1b from CD1 molecules by α-GalCer, which is seen as a “downwards” shift (from acidic to basic) of the migration of the CD1 protein band due to the loss of the negatively charged GT1b species. Percentages under the lanes represent the amount of the total CD1 protein signal that has shifted to the displaced band, as estimated from the band intensities. Lanes shown for CD1d on the right are reproduced from reference (30).

