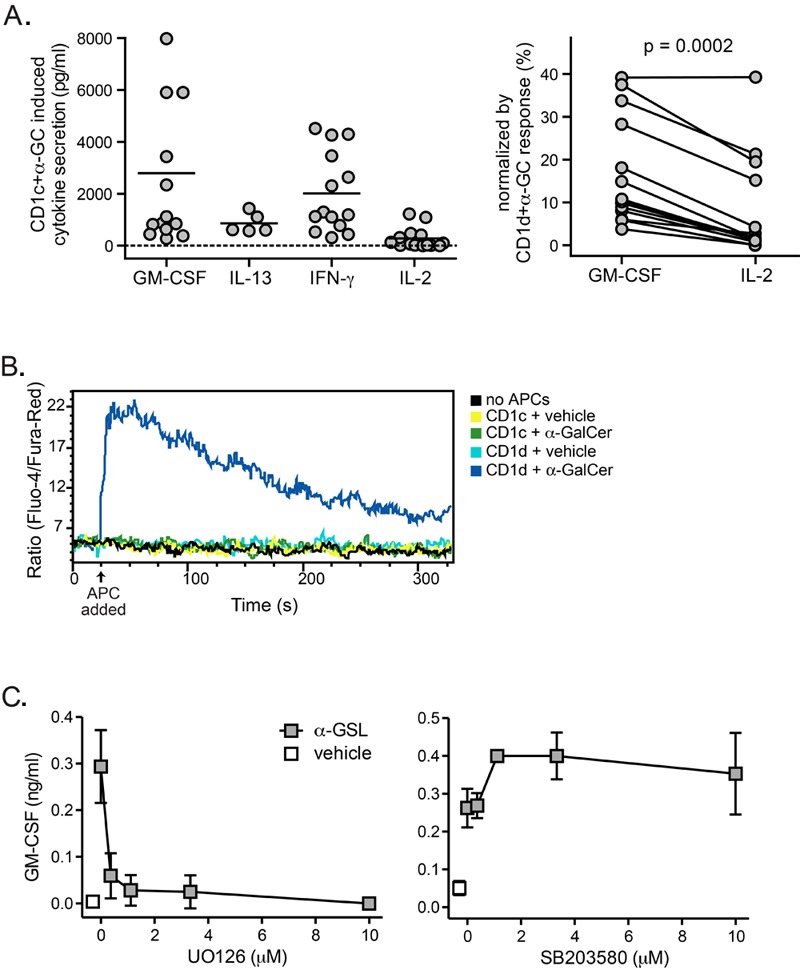
Figure 4. α-GalCer presentated by CD1c acts as a weak agonist. (A) Cytokines produced by human iNKT cell clones in response to α-GalCer presentation by CD1cmolecules. The symbols each represent independent analyses of human iNKT cell responses, and include data from clones J3N.5, JC2.8, J24L.17, GG1.2, and the DaDu polyclonal line. The plot on the left shows the amount of each cytokine produced in response to α-GalCer-pulsed CD1c-transfected K562 cells. The plot on the right shows paired GM-CSF and IL-2 responses from individual iNKT cells normalized by their responses in the same experiments to α-GalCer pulsed CD1d-transfected K562 cells. (B) Analysis of iNKT cell calcium flux. iNKT cells were labeled with the calcium indicator dyes Fluo-4 and Fura-Red and stimulated by contact with CD1c- or CD1d-transfected K562 cells that were pulsed with α-GalCer (200 ng/ml) or vehicle. Ensuing intracellular calcium levels were assessed by flow cytometry. The data shown are from one representative experiment out of three. (C) Effect of MAPK inhibitors on iNKT cell GM-CSF secretion in response to α-GSL presented by plate-bound CD1c-Fc molecules. The left plot shows the effect of the MEK inhibitor U0126, and the right plot shows that of the p38 MAPK inhibitor SB203580. Similar results were observed in 6 independent experiments.

