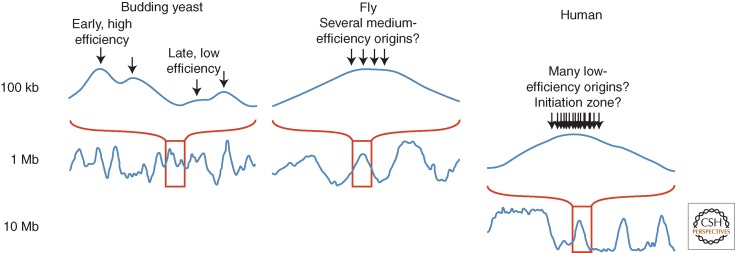
Figure 1.
Scales of replication timing in species with different-sized genomes. Smoothed replication profiles of segments of the human (Ryba et al. 2010), fly (Schwaiger et al. 2009), and budding yeast genomes (Alvino et al. 2007; Yang et al. 2010). Although the profiles look qualitatively similar, they show features on very different scales. In yeasts, the peaks in the replication profiles represent individual origins and the average replication times of origins are determined by a combination of their average firing times and the frequency with which they are passively replicated by forks originating at neighboring origins. In mammals, what appear to be sharp peaks of early replication flatten at higher resolution to broad, near-megabase-sized domains, which contain many unresolved individual replicons. This lack of resolution can be accounted for by spatial or temporal heterogeneity in origin firing within each domain. Fly genomes are an order of magnitude smaller than human, and their domains of coordinate replication are similarly smaller but still probably contain multiple unresolved replicons. The slope of the curves moving away from early-replicating regions is often interpreted as being proportional to the rate of replication in that region. However, even in budding yeasts, where origins can be very efficient, this correlation is not strong; the slope is determined more by the ratio of fork directions than by the rate of those forks (Sekedat et al. 2010; Retkute et al. 2011).

