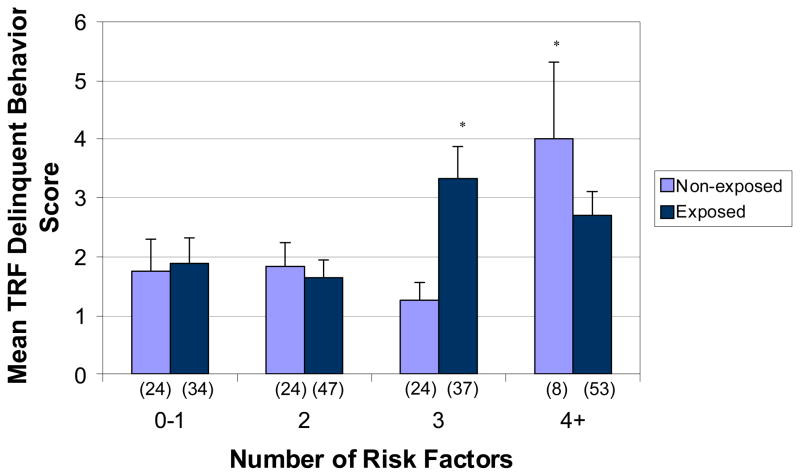
Figure 3.
Mean TRF Delinquent Behavior score as a function of a number of risk factors in non-exposed and exposed groups. Numbers in parentheses are sample sizes for each subgroup. Vertical lines depict standard errors of the means. *p < .01 based on LSD post hoc test for 3 vs. 4 or more risk factors in non-exposed group and for 2 vs. 3 risk factors in exposed group.

