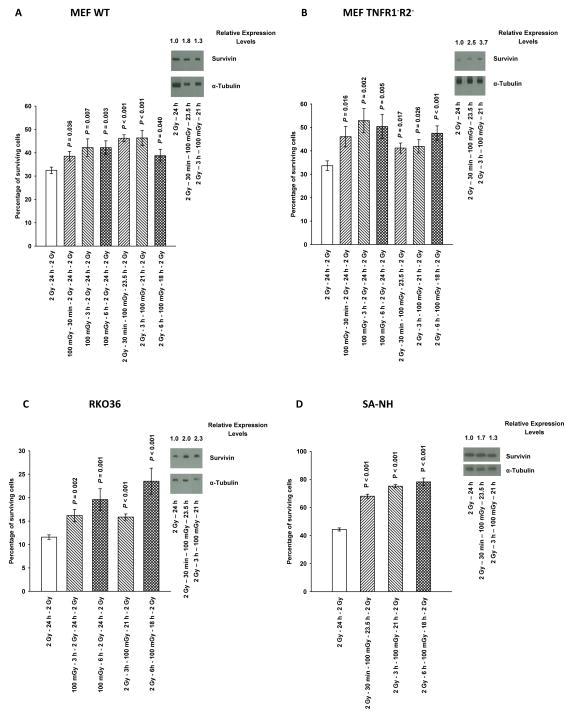
Figure 3.
Cell survival as a function of the timing of a 100 mGy dose given prior to or following the first of two 2 Gy doses separated by 24 h is presented for: transformed mouse embryo fibroblast (MEF) wild type (WT) cells (A); transformed MEF cells lacking tumor necrosis factor receptors 1 and 2 (TNFR1−R2−) (B); human colon carcinoma RKO36 cells (C), and SA-NH mouse sarcoma cells (D). Western blots monitor the relative change in survivin band densities as a function of treatment as compared to cells exposed to a 2 Gy dose only. Times indicate when survivin analysis was performed following the 100 mGy dose and represent survivin levels at 24 h after the first 2 Gy dose. P values were determined by comparing the survival of cells following two 2 Gy doses with those also exposed to an additional 100 mGy dose using a two-tailed Student’s t test with values ≤ 0.05 identified as significant. Each experiment was repeated 3x and error bars represent the SEM.

