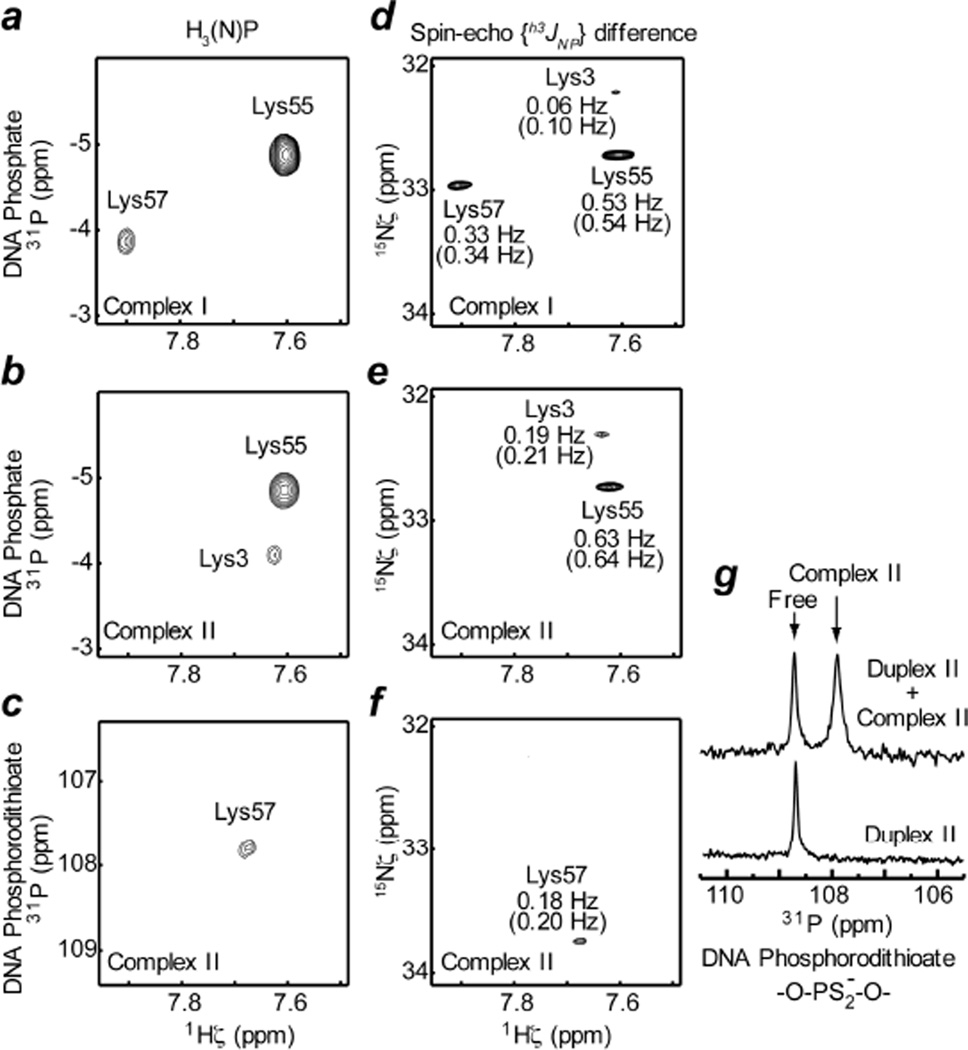
Figure 3.
Hydrogen-bond scalar 15N-31P coupling h3JNP between 15N and 31P nuclei as evidence for the presence of CIP. (a, b, c) 2D H3(N)P spectra that give heteronuclear 1H-31P correlation cross peaks via h3JNP coupling. 31P chemical shifts are relative to trimethylphosphate (TMP). (d, e, f) Difference spectra recorded by the spin-echo h3JNP–modulation constant-time HISQC experiment. Measured absolute values of h3JNP are also indicated. Percentage errors were estimated to be less than 20%. Values in parentheses are h3JNP values taking account of the correction due to partial self-decoupling arising from 31P longitudinal relaxation (see SI). 31P carrier positions were set to −3 ppm for panels a, b, d, and e (for DNA phosphate); and 107 ppm for panels c and f (for DNA phosphorodithioate). Spectra in panels a and d were recorded for Complex I, and spectra in panels b, c, e, and f for Complex II. The pulse sequences and other relevant details are given in Figure S1 in SI. (g) Phosphorodithioate regions of 1D 31P spectra recorded for Duplex II in the free state and a mixture of Duplex II and Complex II. 31P chemical shift of the cross peak in the panel c agrees with 31P chemical shift of the signal from Complex II in the panel g.

