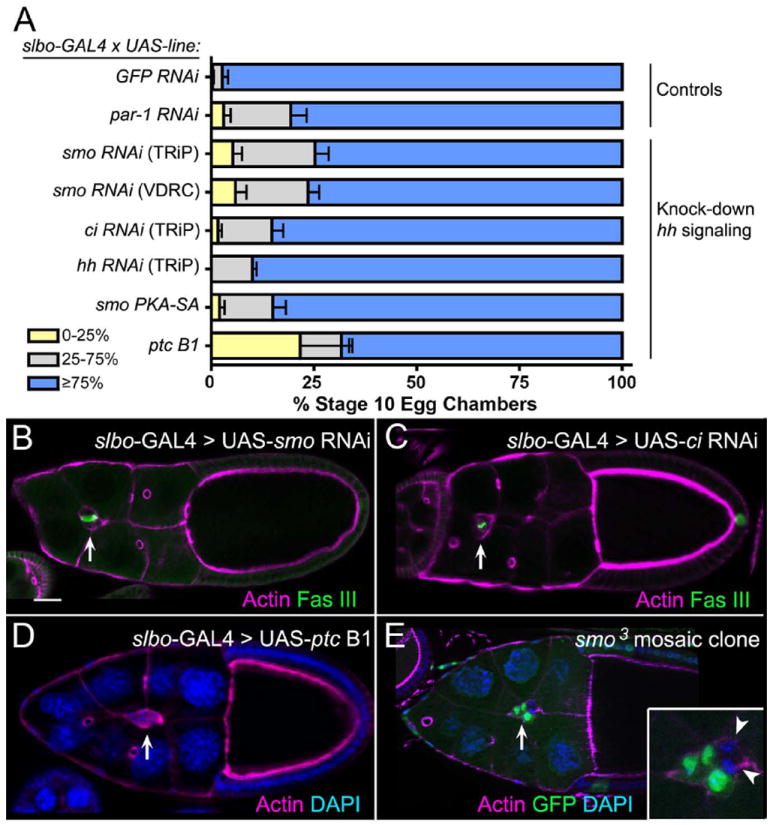
Fig. 4. Migration defects upon loss of Hh pathway members in border cells.

(A) Quantification of border cell migration at stage 10 upon knockdown of Hh pathway components using RNAi or overexpression approaches. Migration is shown as the percentage of border cells that migrated 0-25% (yellow), 26-75% (gray), or ≥76% (blue) of the distance to the oocyte. N ≥ 193 egg chambers for each genotype; at least 3 experiments were performed. Error bars represent standard error of the mean (SEM). (B-E) Fixed stage 10 egg chambers stained for phalloidin to mark F-actin (magenta) at cell membranes and DAPI (blue) to mark nuclei. GFP (green) marks wild-type cells in (E) and Fas III (green) marks polar cell membranes in (B, C). Arrows point to border cells. (B-D) Examples of egg chambers in which RNAi knockdown of smo (B) or ci (C) or in which ptc overexpression (D) is driven by slbo-GAL4; all show incomplete border cell migration. (E) Loss of smo by mosaic clonal analysis reveals a migration defect in a stage 10 egg chamber. Inset shows that two cells in the border cell cluster are mutant (GFP-negative; arrowheads). Scale bar in (B) represents 20 μm.
