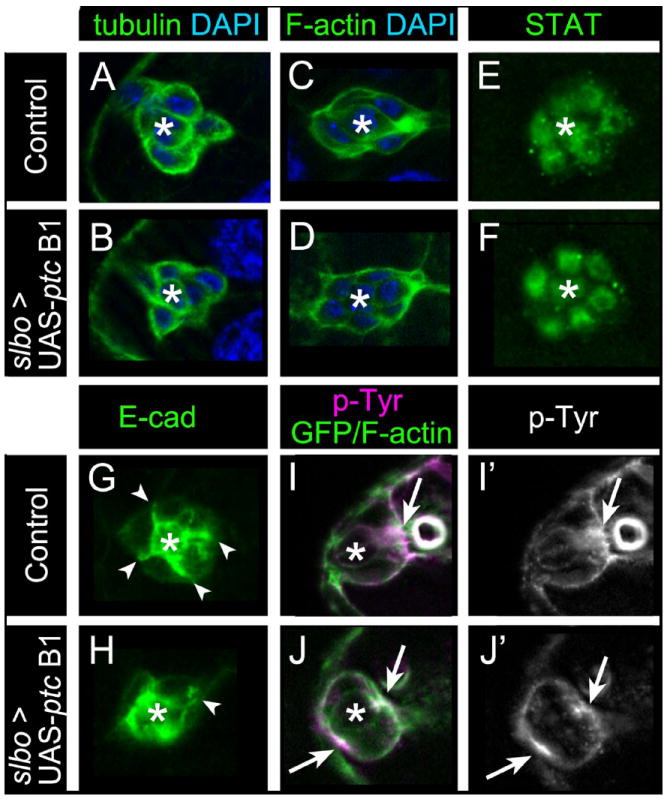
Fig. 6. Loss of Hh signaling affects Ecad and p-Tyr distribution within border cells.

Representative images of stage 9 control slbo-GAL4/+ (A, C, E, G, I) or slbo-GAL4/UAS-ptc B1 (B, D, F, H, J) egg chambers stained for border cell markers; asterisks mark polar cells. (A, B) Border cells labeled for α-tubulin (green) to mark microtubules and DAPI (blue) to label nuclei. Microtubule organization is normal. (C, D) Border cells stained for phalloidin to mark F-actin (green) and DAPI (blue). F-actin localization is normal. (E, F) Border cell nuclei stained for STAT (green). Nuclear STAT is normal. (G, H) Border cells stained for E-cad (green). (G) In control, E-cad is enriched at membranes between border cells (arrowheads) and polar cells (asterisk). (H) ptc B1 cluster in which E-cad distribution is disrupted at border cell membranes; one cell has normal E-cad (arrowhead). (I-J’) Border cells prior to migration stained for p-Tyr (magenta [I, J]; white [I’, J’]) and F-actin/GFP (green in I, J). (I, I’) p-Tyr is enriched at the front of control border cell clusters (arrow). (J, J’) ptc B1 border cell cluster in which p-Tyr is enriched at the front and rear (arrows). N ≥ 10 egg chambers for each genotype.
