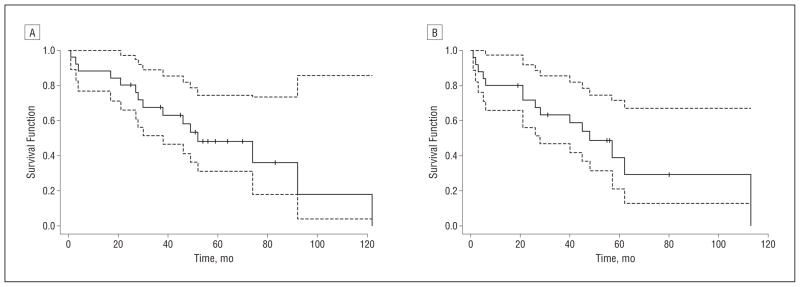
Figure 2.

Kaplan-Meier survival curves. A, From time of diagnosis of paraneoplastic neurologic disorder. B, From start time of tacrolimus treatment. The dotted lines indicate 95% confidence intervals; the tick marks, censored patients; and the solid line, the survival curve.
