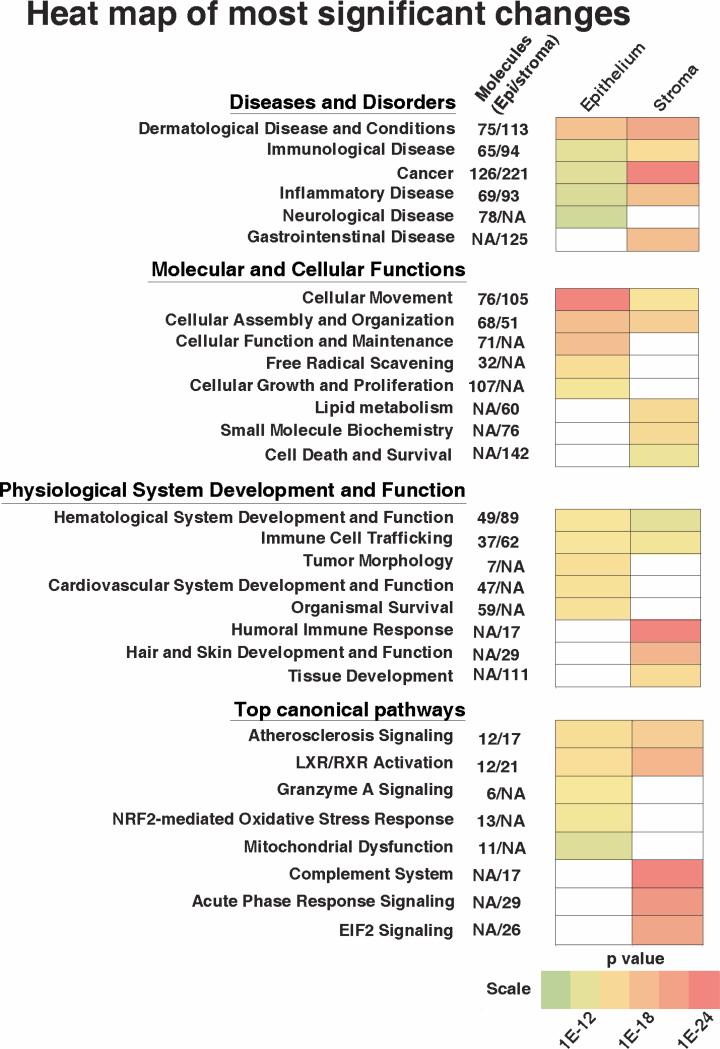
Fig. 4.
Heat map of most significant changes in the KC epithelium and the stroma. The IPA software classified the protein changes into four categories. Within each category certain groups were significantly changed in the KC epithelium or the stroma as indicated by the colors while no color designates lack of correlation with that tissue.

