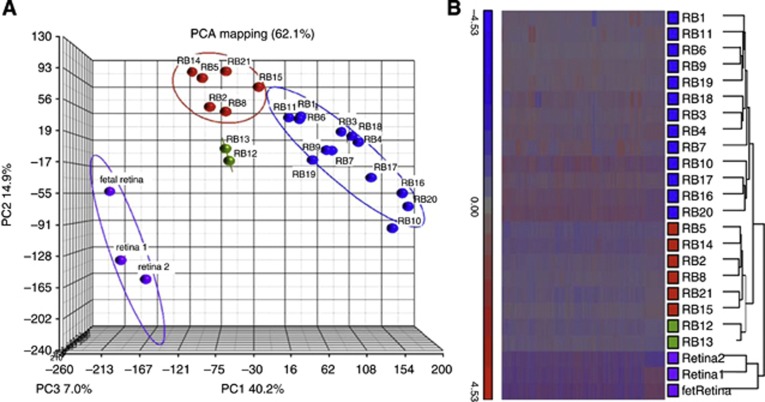
Figure 2.
Retina and retinoblastoma gene expression data. (A) Principal component analysis shows separation of retinoblastoma samples into three groups, group 1 (blue symbols), group 2 (red symbols) and group 3 (green symbols). Normal adult retina and fetal retina are from http://www.ncbi.nlm.nih.gov/geo/. (B) Hierarchical clustering (HC) of the same samples. Colour coding shows concordance with PCA.

