Figure 3.
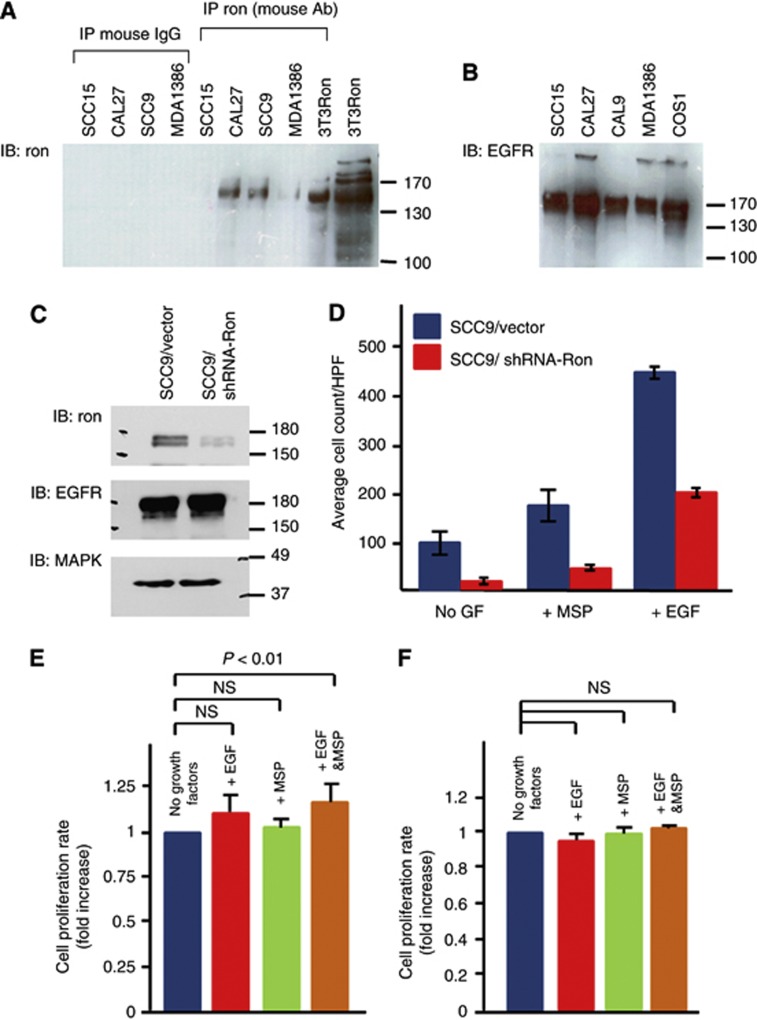
Functional assays of Ron+HNSCC cells. (A) Ron expression in a panel of HNSCC cell lines. The 3T3Ron was positive control. Control precipitations with normal mouse IgG were all negative. (B) The expression of EGFR in a panel of HNSCC cell lines. The COS1 cells known to express EGFR (Agazie and Hayman, 2003a) were the positive control. (C) Ron expression of SCC9 cells stably expressed shRNA against Ron (SCC9/shRNA-Ron) or scrambled sequences (SCC9/Vector). The blot was probed successively with antibodies against Ron, EGFR and finally MAPK as a loading control. (D) Migration of SCC9/shRNA-Ron and SCC9/Vector cells in response to EGF or MSP. GF=growth factor. (E) Cell growth of SCC9 cells in response to EGF, MSP or EGF+MSP. To allow for comparison between the separate experiments (n=8), the proliferation rate of each experiment was calculated from the plot of absorbances over time as the slope of the best fit line. Then, the change in absorbances over time of the unstimulated cells was normalised to 1 and compared with those of the stimulated cells. (F) Cell growth of SCC9/shRNA-Ron cells in response to EGF, MSP or EGF+MSP. The proliferation rate and comparison among the groups were determined and performed as described (n=3). The Bonferroni adjusted P-value is 0.17. NS=not significant. Error bars represent standard errors in 95% confidence interval.

