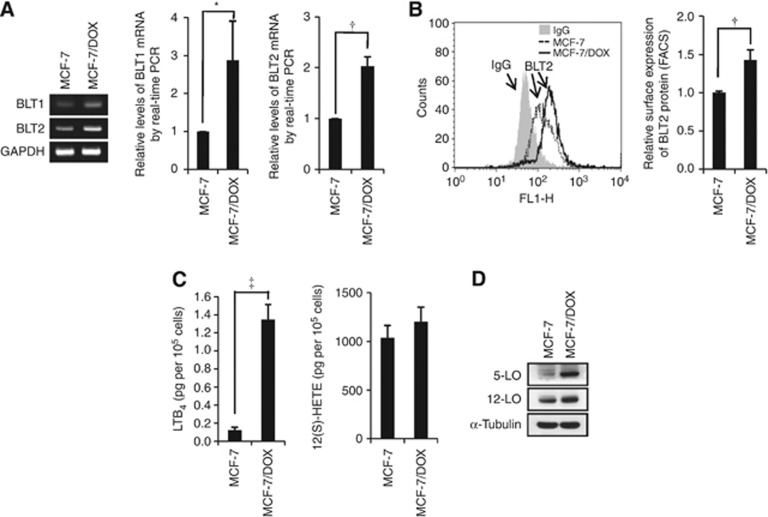
Figure 2.
Upregulation of BLT2 and its ligands in multidrug-resistant MCF-7/DOX cells. (A) Semi-quantitative RT-PCR (left panel) and quantitative real-time PCR (centre and right panels) were performed to analyse BLT1 and BLT2 mRNA levels in MCF-7 and MCF-7/DOX cells. The data are representative of three independent experiments. (B) The expression levels of BLT2 on the cell surface were determined by flow cytometric analysis. (C) MCF-7 (2.5 × 10⁵) and MCF-7/DOX (2.5 × 10⁵) cells were cultured in 35-mm dishes for 48 h, after which the amounts of LTB4 and 12(S)-HETE in the culture supernatants were measured using ELISA assays. (D) The expression levels of 5-LO and 12-LO were determined using immunoblot assays. The data are representative of three independent experiments. All quantitative data are expressed relative to the values for the MCF-7 cells and are shown as the means±s.d. from three independent experiments. *P<0.05, †P<0.01, ‡P<0.005.

